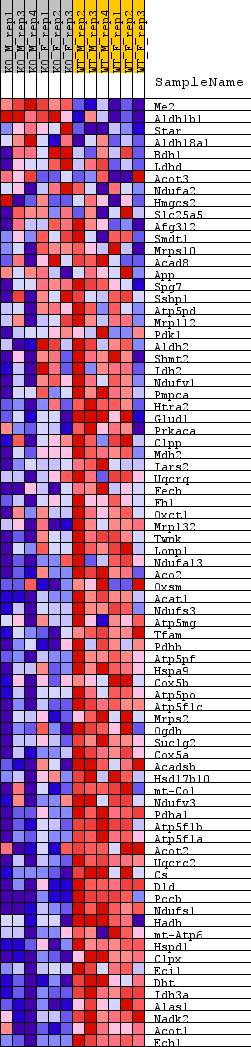
Profile of the Running ES Score & Positions of GeneSet Members on the Rank Ordered List
| Dataset | KO_vs_WT.KO_vs_WT.cls#KO_versus_WT.KO_vs_WT.cls#KO_versus_WT_repos |
| Phenotype | KO_vs_WT.cls#KO_versus_WT_repos |
| Upregulated in class | WT |
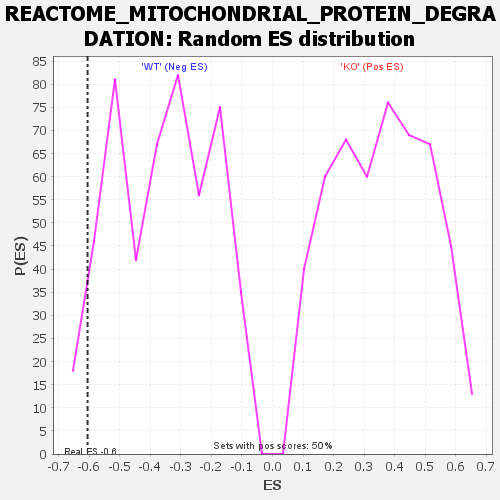
| GeneSet | REACTOME_MITOCHONDRIAL_PROTEIN_DEGRADATION |
| Enrichment Score (ES) | -0.60500854 |
| Normalized Enrichment Score (NES) | -1.6838754 |
| Nominal p-value | 0.04183267 |
| FDR q-value | 0.827123 |
| FWER p-Value | 0.836 |
| SYMBOL | TITLE | RANK IN GENE LIST | RANK METRIC SCORE | RUNNING ES | CORE ENRICHMENT | |
|---|---|---|---|---|---|---|
| 1 | Me2 | Me2 | 507 | 1.110 | 0.0130 | No |
| 2 | Aldh1b1 | Aldh1b1 | 561 | 1.070 | 0.0430 | No |
| 3 | Star | Star | 844 | 0.936 | 0.0599 | No |
| 4 | Aldh18a1 | Aldh18a1 | 3774 | 0.446 | -0.0438 | No |
| 5 | Bdh1 | Bdh1 | 6204 | 0.286 | -0.1322 | No |
| 6 | Ldhd | Ldhd | 9844 | 0.125 | -0.2739 | No |
| 7 | Acot3 | Acot3 | 10485 | 0.099 | -0.2965 | No |
| 8 | Ndufa2 | Ndufa2 | 10991 | 0.080 | -0.3142 | No |
| 9 | Hmgcs2 | Hmgcs2 | 11118 | 0.075 | -0.3170 | No |
| 10 | Slc25a5 | Slc25a5 | 11543 | 0.060 | -0.3322 | No |
| 11 | Afg3l2 | Afg3l2 | 11852 | 0.049 | -0.3430 | No |
| 12 | Smdt1 | Smdt1 | 12717 | 0.019 | -0.3770 | No |
| 13 | Mrps10 | Mrps10 | 14347 | -0.039 | -0.4409 | No |
| 14 | Acad8 | Acad8 | 14534 | -0.046 | -0.4469 | No |
| 15 | App | App | 15780 | -0.090 | -0.4940 | No |
| 16 | Spg7 | Spg7 | 16214 | -0.107 | -0.5081 | No |
| 17 | Ssbp1 | Ssbp1 | 16475 | -0.116 | -0.5149 | No |
| 18 | Atp5pd | Atp5pd | 17242 | -0.146 | -0.5412 | No |
| 19 | Mrpl12 | Mrpl12 | 17265 | -0.147 | -0.5376 | No |
| 20 | Pdk1 | Pdk1 | 17716 | -0.165 | -0.5507 | No |
| 21 | Aldh2 | Aldh2 | 18034 | -0.179 | -0.5579 | No |
| 22 | Shmt2 | Shmt2 | 18278 | -0.190 | -0.5619 | No |
| 23 | Idh2 | Idh2 | 18928 | -0.218 | -0.5813 | No |
| 24 | Ndufv1 | Ndufv1 | 19255 | -0.232 | -0.5874 | No |
| 25 | Pmpca | Pmpca | 19307 | -0.235 | -0.5824 | No |
| 26 | Htra2 | Htra2 | 19875 | -0.264 | -0.5971 | Yes |
| 27 | Glud1 | Glud1 | 19892 | -0.265 | -0.5898 | Yes |
| 28 | Prkaca | Prkaca | 20069 | -0.275 | -0.5886 | Yes |
| 29 | Clpp | Clpp | 20106 | -0.277 | -0.5817 | Yes |
| 30 | Mdh2 | Mdh2 | 20172 | -0.280 | -0.5759 | Yes |
| 31 | Iars2 | Iars2 | 20346 | -0.289 | -0.5741 | Yes |
| 32 | Uqcrq | Uqcrq | 20690 | -0.309 | -0.5785 | Yes |
| 33 | Fech | Fech | 20692 | -0.310 | -0.5693 | Yes |
| 34 | Fh1 | Fh1 | 20746 | -0.312 | -0.5620 | Yes |
| 35 | Oxct1 | Oxct1 | 20831 | -0.317 | -0.5559 | Yes |
| 36 | Mrpl32 | Mrpl32 | 20877 | -0.319 | -0.5481 | Yes |
| 37 | Twnk | Twnk | 20879 | -0.319 | -0.5386 | Yes |
| 38 | Lonp1 | Lonp1 | 20881 | -0.319 | -0.5290 | Yes |
| 39 | Ndufa13 | Ndufa13 | 20896 | -0.320 | -0.5200 | Yes |
| 40 | Aco2 | Aco2 | 20932 | -0.322 | -0.5117 | Yes |
| 41 | Oxsm | Oxsm | 21467 | -0.358 | -0.5223 | Yes |
| 42 | Acat1 | Acat1 | 21629 | -0.370 | -0.5176 | Yes |
| 43 | Ndufs3 | Ndufs3 | 21648 | -0.372 | -0.5072 | Yes |
| 44 | Atp5mg | Atp5mg | 21756 | -0.379 | -0.5001 | Yes |
| 45 | Tfam | Tfam | 21956 | -0.395 | -0.4962 | Yes |
| 46 | Pdhb | Pdhb | 21963 | -0.395 | -0.4846 | Yes |
| 47 | Atp5pf | Atp5pf | 22184 | -0.413 | -0.4809 | Yes |
| 48 | Hspa9 | Hspa9 | 22229 | -0.416 | -0.4702 | Yes |
| 49 | Cox5b | Cox5b | 22296 | -0.423 | -0.4601 | Yes |
| 50 | Atp5po | Atp5po | 22300 | -0.423 | -0.4476 | Yes |
| 51 | Atp5f1c | Atp5f1c | 22331 | -0.426 | -0.4360 | Yes |
| 52 | Mrps2 | Mrps2 | 22612 | -0.455 | -0.4335 | Yes |
| 53 | Ogdh | Ogdh | 22746 | -0.468 | -0.4248 | Yes |
| 54 | Suclg2 | Suclg2 | 22786 | -0.473 | -0.4121 | Yes |
| 55 | Cox5a | Cox5a | 22788 | -0.474 | -0.3979 | Yes |
| 56 | Acadsb | Acadsb | 22798 | -0.475 | -0.3841 | Yes |
| 57 | Hsd17b10 | Hsd17b10 | 22799 | -0.475 | -0.3698 | Yes |
| 58 | mt-Co1 | mt-Co1 | 22956 | -0.493 | -0.3612 | Yes |
| 59 | Ndufv3 | Ndufv3 | 23094 | -0.507 | -0.3515 | Yes |
| 60 | Pdha1 | Pdha1 | 23160 | -0.515 | -0.3386 | Yes |
| 61 | Atp5f1b | Atp5f1b | 23271 | -0.531 | -0.3271 | Yes |
| 62 | Atp5f1a | Atp5f1a | 23289 | -0.533 | -0.3117 | Yes |
| 63 | Acot2 | Acot2 | 23356 | -0.542 | -0.2981 | Yes |
| 64 | Uqcrc2 | Uqcrc2 | 23430 | -0.554 | -0.2844 | Yes |
| 65 | Cs | Cs | 23678 | -0.593 | -0.2764 | Yes |
| 66 | Dld | Dld | 23723 | -0.603 | -0.2601 | Yes |
| 67 | Pccb | Pccb | 23765 | -0.612 | -0.2434 | Yes |
| 68 | Ndufs1 | Ndufs1 | 23812 | -0.621 | -0.2266 | Yes |
| 69 | Hadh | Hadh | 23900 | -0.638 | -0.2109 | Yes |
| 70 | mt-Atp6 | mt-Atp6 | 24010 | -0.668 | -0.1952 | Yes |
| 71 | Hspd1 | Hspd1 | 24017 | -0.671 | -0.1753 | Yes |
| 72 | Clpx | Clpx | 24190 | -0.723 | -0.1605 | Yes |
| 73 | Eci1 | Eci1 | 24279 | -0.753 | -0.1414 | Yes |
| 74 | Dbt | Dbt | 24433 | -0.805 | -0.1234 | Yes |
| 75 | Idh3a | Idh3a | 24435 | -0.805 | -0.0992 | Yes |
| 76 | Alas1 | Alas1 | 24642 | -0.912 | -0.0801 | Yes |
| 77 | Nadk2 | Nadk2 | 24663 | -0.932 | -0.0529 | Yes |
| 78 | Acot1 | Acot1 | 24805 | -1.091 | -0.0258 | Yes |
| 79 | Ech1 | Ech1 | 24903 | -1.260 | 0.0082 | Yes |