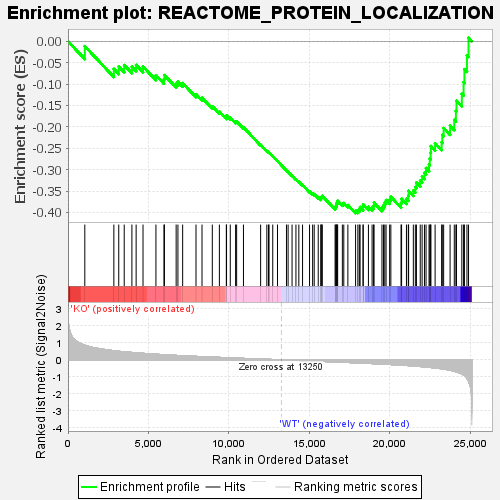
Profile of the Running ES Score & Positions of GeneSet Members on the Rank Ordered List
| Dataset | KO_vs_WT.KO_vs_WT.cls#KO_versus_WT.KO_vs_WT.cls#KO_versus_WT_repos |
| Phenotype | KO_vs_WT.cls#KO_versus_WT_repos |
| Upregulated in class | WT |
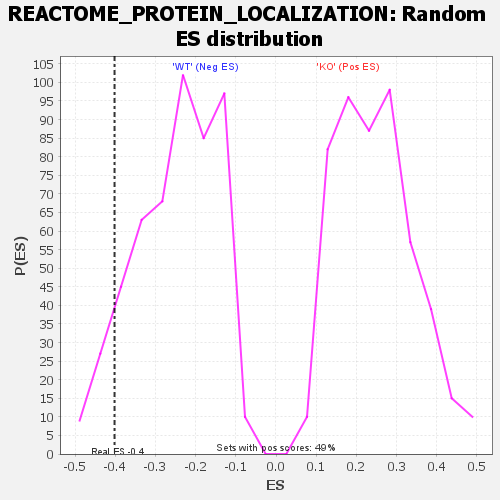
| GeneSet | REACTOME_PROTEIN_LOCALIZATION |
| Enrichment Score (ES) | -0.40190616 |
| Normalized Enrichment Score (NES) | -1.6165136 |
| Nominal p-value | 0.07905138 |
| FDR q-value | 0.6745272 |
| FWER p-Value | 0.942 |
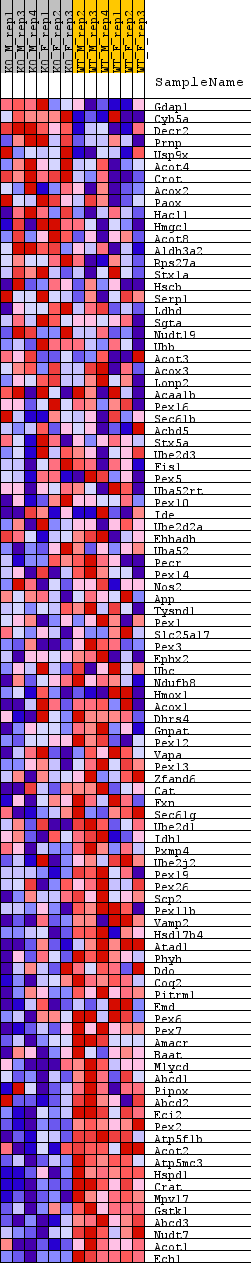
| SYMBOL | TITLE | RANK IN GENE LIST | RANK METRIC SCORE | RUNNING ES | CORE ENRICHMENT | |
|---|---|---|---|---|---|---|
| 1 | Gdap1 | Gdap1 | 1045 | 0.854 | -0.0115 | No |
| 2 | Cyb5a | Cyb5a | 2851 | 0.534 | -0.0646 | No |
| 3 | Decr2 | Decr2 | 3155 | 0.503 | -0.0589 | No |
| 4 | Prnp | Prnp | 3495 | 0.472 | -0.0557 | No |
| 5 | Usp9x | Usp9x | 3973 | 0.432 | -0.0594 | No |
| 6 | Acot4 | Acot4 | 4236 | 0.410 | -0.0553 | No |
| 7 | Crot | Crot | 4664 | 0.379 | -0.0589 | No |
| 8 | Acox2 | Acox2 | 5467 | 0.329 | -0.0793 | No |
| 9 | Paox | Paox | 5966 | 0.300 | -0.0886 | No |
| 10 | Hacl1 | Hacl1 | 5996 | 0.299 | -0.0791 | No |
| 11 | Hmgcl | Hmgcl | 6724 | 0.258 | -0.0990 | No |
| 12 | Acot8 | Acot8 | 6835 | 0.253 | -0.0945 | No |
| 13 | Aldh3a2 | Aldh3a2 | 7129 | 0.238 | -0.0977 | No |
| 14 | Rps27a | Rps27a | 7958 | 0.201 | -0.1237 | No |
| 15 | Stx1a | Stx1a | 8332 | 0.185 | -0.1320 | No |
| 16 | Hscb | Hscb | 8972 | 0.160 | -0.1519 | No |
| 17 | Serp1 | Serp1 | 9412 | 0.142 | -0.1644 | No |
| 18 | Ldhd | Ldhd | 9844 | 0.125 | -0.1772 | No |
| 19 | Sgta | Sgta | 9857 | 0.124 | -0.1733 | No |
| 20 | Nudt19 | Nudt19 | 10089 | 0.115 | -0.1785 | No |
| 21 | Ubb | Ubb | 10421 | 0.102 | -0.1881 | No |
| 22 | Acot3 | Acot3 | 10485 | 0.099 | -0.1871 | No |
| 23 | Acox3 | Acox3 | 10909 | 0.083 | -0.2011 | No |
| 24 | Lonp2 | Lonp2 | 11977 | 0.045 | -0.2421 | No |
| 25 | Acaa1b | Acaa1b | 12362 | 0.031 | -0.2564 | No |
| 26 | Pex16 | Pex16 | 12465 | 0.028 | -0.2595 | No |
| 27 | Sec61b | Sec61b | 12499 | 0.027 | -0.2599 | No |
| 28 | Acbd5 | Acbd5 | 12730 | 0.019 | -0.2684 | No |
| 29 | Stx5a | Stx5a | 13025 | 0.008 | -0.2799 | No |
| 30 | Ube2d3 | Ube2d3 | 13583 | -0.012 | -0.3017 | No |
| 31 | Fis1 | Fis1 | 13685 | -0.016 | -0.3052 | No |
| 32 | Pex5 | Pex5 | 13931 | -0.024 | -0.3141 | No |
| 33 | Uba52rt | Uba52rt | 14172 | -0.033 | -0.3225 | No |
| 34 | Pex10 | Pex10 | 14352 | -0.039 | -0.3283 | No |
| 35 | Ide | Ide | 14583 | -0.048 | -0.3358 | No |
| 36 | Ube2d2a | Ube2d2a | 15018 | -0.063 | -0.3509 | No |
| 37 | Ehhadh | Ehhadh | 15210 | -0.071 | -0.3560 | No |
| 38 | Uba52 | Uba52 | 15308 | -0.074 | -0.3573 | No |
| 39 | Pecr | Pecr | 15558 | -0.083 | -0.3643 | No |
| 40 | Pex14 | Pex14 | 15723 | -0.089 | -0.3677 | No |
| 41 | Nos2 | Nos2 | 15732 | -0.089 | -0.3648 | No |
| 42 | App | App | 15780 | -0.090 | -0.3635 | No |
| 43 | Tysnd1 | Tysnd1 | 15808 | -0.092 | -0.3613 | No |
| 44 | Pex1 | Pex1 | 16606 | -0.121 | -0.3889 | No |
| 45 | Slc25a17 | Slc25a17 | 16643 | -0.123 | -0.3860 | No |
| 46 | Pex3 | Pex3 | 16687 | -0.124 | -0.3833 | No |
| 47 | Ephx2 | Ephx2 | 16691 | -0.124 | -0.3790 | No |
| 48 | Ubc | Ubc | 16741 | -0.126 | -0.3765 | No |
| 49 | Ndufb8 | Ndufb8 | 16766 | -0.127 | -0.3729 | No |
| 50 | Hmox1 | Hmox1 | 17058 | -0.139 | -0.3796 | No |
| 51 | Acox1 | Acox1 | 17147 | -0.143 | -0.3781 | No |
| 52 | Dhrs4 | Dhrs4 | 17401 | -0.153 | -0.3828 | No |
| 53 | Gnpat | Gnpat | 17880 | -0.173 | -0.3958 | Yes |
| 54 | Pex12 | Pex12 | 18022 | -0.179 | -0.3951 | Yes |
| 55 | Vapa | Vapa | 18113 | -0.183 | -0.3922 | Yes |
| 56 | Pex13 | Pex13 | 18160 | -0.185 | -0.3874 | Yes |
| 57 | Zfand6 | Zfand6 | 18349 | -0.193 | -0.3881 | Yes |
| 58 | Cat | Cat | 18350 | -0.193 | -0.3812 | Yes |
| 59 | Fxn | Fxn | 18679 | -0.207 | -0.3870 | Yes |
| 60 | Sec61g | Sec61g | 18907 | -0.218 | -0.3883 | Yes |
| 61 | Ube2d1 | Ube2d1 | 19000 | -0.221 | -0.3841 | Yes |
| 62 | Idh1 | Idh1 | 19028 | -0.222 | -0.3773 | Yes |
| 63 | Pxmp4 | Pxmp4 | 19521 | -0.245 | -0.3883 | Yes |
| 64 | Ube2j2 | Ube2j2 | 19618 | -0.251 | -0.3832 | Yes |
| 65 | Pex19 | Pex19 | 19697 | -0.256 | -0.3773 | Yes |
| 66 | Pex26 | Pex26 | 19775 | -0.259 | -0.3711 | Yes |
| 67 | Scp2 | Scp2 | 19998 | -0.271 | -0.3704 | Yes |
| 68 | Pex11b | Pex11b | 20073 | -0.275 | -0.3636 | Yes |
| 69 | Vamp2 | Vamp2 | 20707 | -0.310 | -0.3779 | Yes |
| 70 | Hsd17b4 | Hsd17b4 | 20741 | -0.312 | -0.3681 | Yes |
| 71 | Atad1 | Atad1 | 21043 | -0.330 | -0.3685 | Yes |
| 72 | Phyh | Phyh | 21158 | -0.336 | -0.3611 | Yes |
| 73 | Ddo | Ddo | 21177 | -0.338 | -0.3498 | Yes |
| 74 | Coq2 | Coq2 | 21471 | -0.358 | -0.3488 | Yes |
| 75 | Pitrm1 | Pitrm1 | 21595 | -0.368 | -0.3406 | Yes |
| 76 | Emd | Emd | 21664 | -0.373 | -0.3301 | Yes |
| 77 | Pex6 | Pex6 | 21900 | -0.391 | -0.3256 | Yes |
| 78 | Pex7 | Pex7 | 22016 | -0.399 | -0.3160 | Yes |
| 79 | Amacr | Amacr | 22163 | -0.411 | -0.3073 | Yes |
| 80 | Baat | Baat | 22261 | -0.420 | -0.2963 | Yes |
| 81 | Mlycd | Mlycd | 22448 | -0.436 | -0.2882 | Yes |
| 82 | Abcd1 | Abcd1 | 22494 | -0.441 | -0.2743 | Yes |
| 83 | Pipox | Pipox | 22547 | -0.448 | -0.2605 | Yes |
| 84 | Abcd2 | Abcd2 | 22560 | -0.450 | -0.2450 | Yes |
| 85 | Eci2 | Eci2 | 22825 | -0.478 | -0.2386 | Yes |
| 86 | Pex2 | Pex2 | 23231 | -0.526 | -0.2361 | Yes |
| 87 | Atp5f1b | Atp5f1b | 23271 | -0.531 | -0.2188 | Yes |
| 88 | Acot2 | Acot2 | 23356 | -0.542 | -0.2029 | Yes |
| 89 | Atp5mc3 | Atp5mc3 | 23756 | -0.610 | -0.1972 | Yes |
| 90 | Hspd1 | Hspd1 | 24017 | -0.671 | -0.1838 | Yes |
| 91 | Crat | Crat | 24117 | -0.702 | -0.1628 | Yes |
| 92 | Mpv17 | Mpv17 | 24154 | -0.712 | -0.1390 | Yes |
| 93 | Gstk1 | Gstk1 | 24487 | -0.827 | -0.1229 | Yes |
| 94 | Abcd3 | Abcd3 | 24595 | -0.885 | -0.0957 | Yes |
| 95 | Nudt7 | Nudt7 | 24648 | -0.916 | -0.0652 | Yes |
| 96 | Acot1 | Acot1 | 24805 | -1.091 | -0.0327 | Yes |
| 97 | Ech1 | Ech1 | 24903 | -1.260 | 0.0082 | Yes |