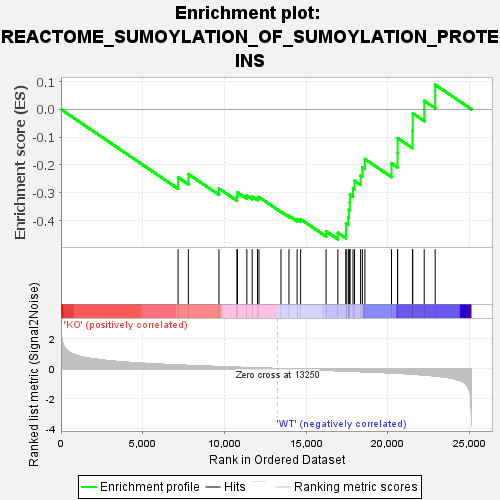
Profile of the Running ES Score & Positions of GeneSet Members on the Rank Ordered List
| Dataset | KO_vs_WT.KO_vs_WT.cls#KO_versus_WT.KO_vs_WT.cls#KO_versus_WT_repos |
| Phenotype | KO_vs_WT.cls#KO_versus_WT_repos |
| Upregulated in class | WT |
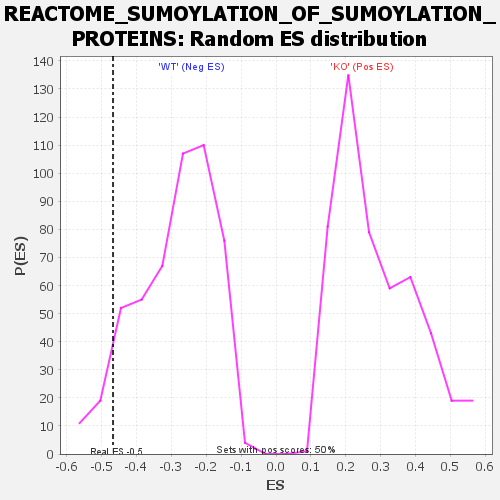
| GeneSet | REACTOME_SUMOYLATION_OF_SUMOYLATION_PROTEINS |
| Enrichment Score (ES) | -0.4672673 |
| Normalized Enrichment Score (NES) | -1.6114423 |
| Nominal p-value | 0.063872255 |
| FDR q-value | 0.6528595 |
| FWER p-Value | 0.947 |
| SYMBOL | TITLE | RANK IN GENE LIST | RANK METRIC SCORE | RUNNING ES | CORE ENRICHMENT | |
|---|---|---|---|---|---|---|
| 1 | Nup155 | Nup155 | 7161 | 0.237 | -0.2442 | No |
| 2 | Tpr | Tpr | 7789 | 0.208 | -0.2328 | No |
| 3 | Ranbp2 | Ranbp2 | 9662 | 0.132 | -0.2845 | No |
| 4 | Nup93 | Nup93 | 10761 | 0.088 | -0.3129 | No |
| 5 | Aaas | Aaas | 10792 | 0.087 | -0.2989 | No |
| 6 | Nup160 | Nup160 | 11368 | 0.066 | -0.3103 | No |
| 7 | Topors | Topors | 11693 | 0.054 | -0.3137 | No |
| 8 | Nup37 | Nup37 | 12016 | 0.044 | -0.3189 | No |
| 9 | Nup42 | Nup42 | 12109 | 0.040 | -0.3156 | No |
| 10 | Sec13 | Sec13 | 13455 | -0.007 | -0.3680 | No |
| 11 | Nup205 | Nup205 | 13944 | -0.025 | -0.3831 | No |
| 12 | Rae1 | Rae1 | 14442 | -0.042 | -0.3955 | No |
| 13 | Nup107 | Nup107 | 14656 | -0.051 | -0.3952 | No |
| 14 | Nup43 | Nup43 | 16213 | -0.107 | -0.4386 | No |
| 15 | Sumo2 | Sumo2 | 16933 | -0.134 | -0.4438 | Yes |
| 16 | Pom121 | Pom121 | 17433 | -0.154 | -0.4369 | Yes |
| 17 | Ube2i | Ube2i | 17435 | -0.154 | -0.4101 | Yes |
| 18 | Nup35 | Nup35 | 17569 | -0.159 | -0.3876 | Yes |
| 19 | Nup210 | Nup210 | 17610 | -0.160 | -0.3612 | Yes |
| 20 | Nup188 | Nup188 | 17664 | -0.163 | -0.3348 | Yes |
| 21 | Sumo1 | Sumo1 | 17675 | -0.163 | -0.3067 | Yes |
| 22 | Nup50 | Nup50 | 17861 | -0.172 | -0.2841 | Yes |
| 23 | Pias4 | Pias4 | 17953 | -0.176 | -0.2570 | Yes |
| 24 | Nup153 | Nup153 | 18326 | -0.192 | -0.2383 | Yes |
| 25 | Nup98 | Nup98 | 18434 | -0.197 | -0.2081 | Yes |
| 26 | Seh1l | Seh1l | 18589 | -0.203 | -0.1788 | Yes |
| 27 | Nup214 | Nup214 | 20215 | -0.282 | -0.1943 | Yes |
| 28 | Nup85 | Nup85 | 20585 | -0.303 | -0.1561 | Yes |
| 29 | Nup54 | Nup54 | 20591 | -0.303 | -0.1034 | Yes |
| 30 | Nup88 | Nup88 | 21498 | -0.360 | -0.0766 | Yes |
| 31 | Nup62 | Nup62 | 21516 | -0.361 | -0.0141 | Yes |
| 32 | Nup133 | Nup133 | 22216 | -0.416 | 0.0306 | Yes |
| 33 | Ndc1 | Ndc1 | 22885 | -0.485 | 0.0886 | Yes |