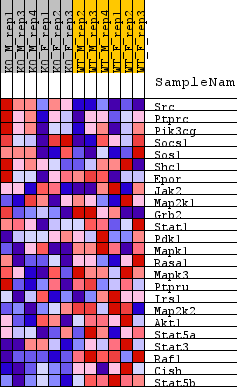
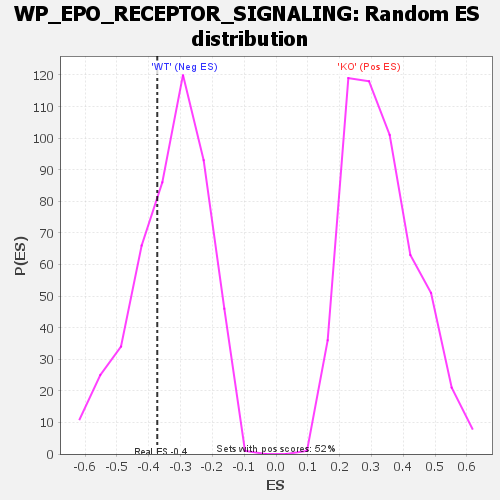
Profile of the Running ES Score & Positions of GeneSet Members on the Rank Ordered List
| Dataset | KO_vs_WT.KO_vs_WT.cls#KO_versus_WT.KO_vs_WT.cls#KO_versus_WT_repos |
| Phenotype | KO_vs_WT.cls#KO_versus_WT_repos |
| Upregulated in class | WT |
| GeneSet | WP_EPO_RECEPTOR_SIGNALING |
| Enrichment Score (ES) | -0.373007 |
| Normalized Enrichment Score (NES) | -1.1212411 |
| Nominal p-value | 0.34232366 |
| FDR q-value | 0.87232375 |
| FWER p-Value | 0.994 |
| SYMBOL | TITLE | RANK IN GENE LIST | RANK METRIC SCORE | RUNNING ES | CORE ENRICHMENT | |
|---|---|---|---|---|---|---|
| 1 | Src | Src | 954 | 0.889 | 0.1026 | No |
| 2 | Ptprc | Ptprc | 4855 | 0.366 | 0.0050 | No |
| 3 | Pik3cg | Pik3cg | 7381 | 0.227 | -0.0598 | No |
| 4 | Socs1 | Socs1 | 9057 | 0.156 | -0.1019 | No |
| 5 | Sos1 | Sos1 | 9483 | 0.139 | -0.0969 | No |
| 6 | Shc1 | Shc1 | 11228 | 0.071 | -0.1552 | No |
| 7 | Epor | Epor | 12125 | 0.040 | -0.1847 | No |
| 8 | Jak2 | Jak2 | 12305 | 0.033 | -0.1865 | No |
| 9 | Map2k1 | Map2k1 | 14564 | -0.047 | -0.2691 | No |
| 10 | Grb2 | Grb2 | 17172 | -0.143 | -0.3503 | Yes |
| 11 | Stat1 | Stat1 | 17229 | -0.146 | -0.3295 | Yes |
| 12 | Pdk1 | Pdk1 | 17716 | -0.165 | -0.3228 | Yes |
| 13 | Mapk1 | Mapk1 | 18437 | -0.197 | -0.3203 | Yes |
| 14 | Rasa1 | Rasa1 | 18958 | -0.219 | -0.3064 | Yes |
| 15 | Mapk3 | Mapk3 | 19068 | -0.224 | -0.2753 | Yes |
| 16 | Ptpru | Ptpru | 19119 | -0.226 | -0.2414 | Yes |
| 17 | Irs1 | Irs1 | 19600 | -0.250 | -0.2210 | Yes |
| 18 | Map2k2 | Map2k2 | 19750 | -0.258 | -0.1862 | Yes |
| 19 | Akt1 | Akt1 | 19946 | -0.268 | -0.1516 | Yes |
| 20 | Stat5a | Stat5a | 20939 | -0.322 | -0.1401 | Yes |
| 21 | Stat3 | Stat3 | 21544 | -0.364 | -0.1067 | Yes |
| 22 | Raf1 | Raf1 | 22482 | -0.440 | -0.0745 | Yes |
| 23 | Cish | Cish | 23519 | -0.565 | -0.0264 | Yes |
| 24 | Stat5b | Stat5b | 23534 | -0.567 | 0.0627 | Yes |