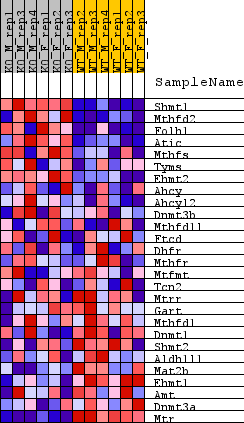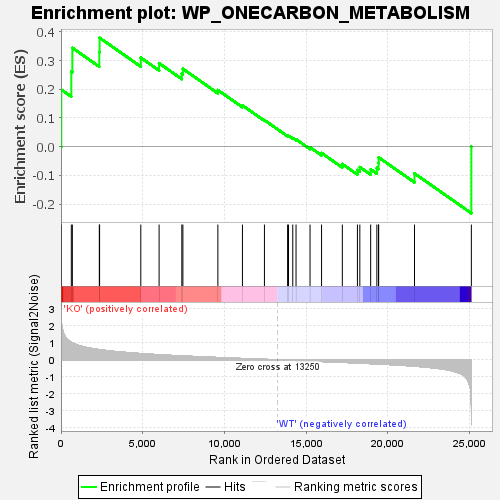
Profile of the Running ES Score & Positions of GeneSet Members on the Rank Ordered List
| Dataset | KO_vs_WT.KO_vs_WT.cls#KO_versus_WT.KO_vs_WT.cls#KO_versus_WT_repos |
| Phenotype | KO_vs_WT.cls#KO_versus_WT_repos |
| Upregulated in class | KO |
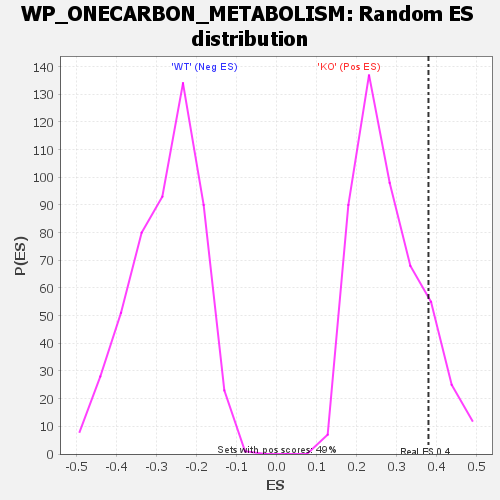
| GeneSet | WP_ONECARBON_METABOLISM |
| Enrichment Score (ES) | 0.37909883 |
| Normalized Enrichment Score (NES) | 1.3618128 |
| Nominal p-value | 0.12601626 |
| FDR q-value | 1.0 |
| FWER p-Value | 0.926 |
| SYMBOL | TITLE | RANK IN GENE LIST | RANK METRIC SCORE | RUNNING ES | CORE ENRICHMENT | |
|---|---|---|---|---|---|---|
| 1 | Shmt1 | Shmt1 | 19 | 2.339 | 0.1986 | Yes |
| 2 | Mthfd2 | Mthfd2 | 631 | 1.027 | 0.2617 | Yes |
| 3 | Folh1 | Folh1 | 694 | 0.995 | 0.3440 | Yes |
| 4 | Atic | Atic | 2343 | 0.597 | 0.3292 | Yes |
| 5 | Mthfs | Mthfs | 2361 | 0.594 | 0.3791 | Yes |
| 6 | Tyms | Tyms | 4881 | 0.365 | 0.3097 | No |
| 7 | Ehmt2 | Ehmt2 | 6000 | 0.298 | 0.2906 | No |
| 8 | Ahcy | Ahcy | 7390 | 0.227 | 0.2545 | No |
| 9 | Ahcyl2 | Ahcyl2 | 7455 | 0.224 | 0.2710 | No |
| 10 | Dnmt3b | Dnmt3b | 9595 | 0.134 | 0.1972 | No |
| 11 | Mthfd1l | Mthfd1l | 11098 | 0.076 | 0.1437 | No |
| 12 | Ftcd | Ftcd | 12443 | 0.028 | 0.0926 | No |
| 13 | Dhfr | Dhfr | 13860 | -0.021 | 0.0379 | No |
| 14 | Mthfr | Mthfr | 13916 | -0.023 | 0.0377 | No |
| 15 | Mtfmt | Mtfmt | 14176 | -0.034 | 0.0303 | No |
| 16 | Tcn2 | Tcn2 | 14376 | -0.040 | 0.0258 | No |
| 17 | Mtrr | Mtrr | 15232 | -0.072 | -0.0022 | No |
| 18 | Gart | Gart | 15937 | -0.097 | -0.0220 | No |
| 19 | Mthfd1 | Mthfd1 | 17208 | -0.145 | -0.0603 | No |
| 20 | Dnmt1 | Dnmt1 | 18131 | -0.184 | -0.0814 | No |
| 21 | Shmt2 | Shmt2 | 18278 | -0.190 | -0.0711 | No |
| 22 | Aldh1l1 | Aldh1l1 | 18941 | -0.219 | -0.0788 | No |
| 23 | Mat2b | Mat2b | 19319 | -0.235 | -0.0738 | No |
| 24 | Ehmt1 | Ehmt1 | 19422 | -0.240 | -0.0574 | No |
| 25 | Amt | Amt | 19429 | -0.240 | -0.0372 | No |
| 26 | Dnmt3a | Dnmt3a | 21622 | -0.370 | -0.0931 | No |
| 27 | Mtr | Mtr | 25099 | -2.722 | 0.0003 | No |