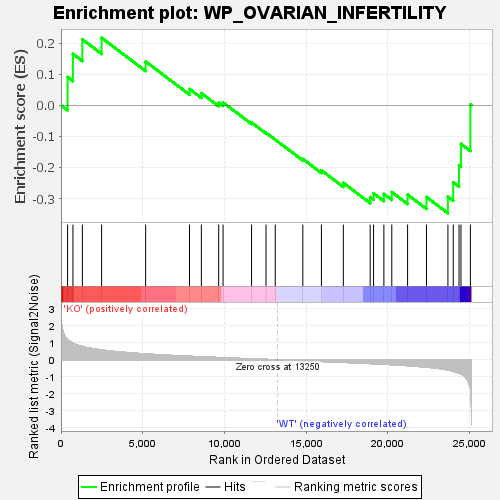
Profile of the Running ES Score & Positions of GeneSet Members on the Rank Ordered List
| Dataset | KO_vs_WT.KO_vs_WT.cls#KO_versus_WT.KO_vs_WT.cls#KO_versus_WT_repos |
| Phenotype | KO_vs_WT.cls#KO_versus_WT_repos |
| Upregulated in class | WT |
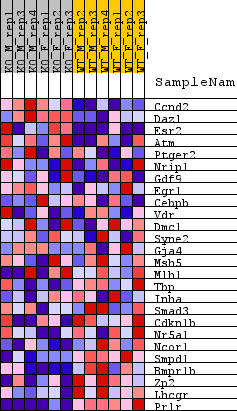
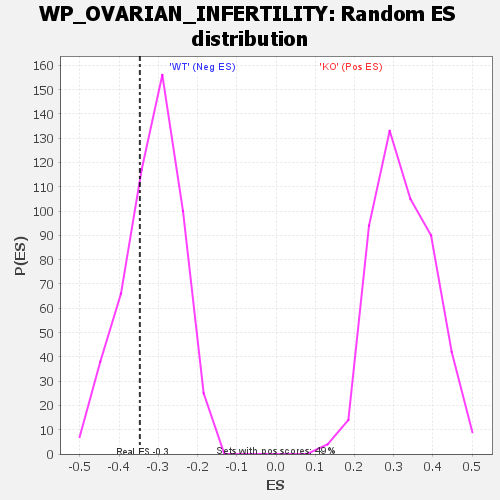
| GeneSet | WP_OVARIAN_INFERTILITY |
| Enrichment Score (ES) | -0.34722662 |
| Normalized Enrichment Score (NES) | -1.0999528 |
| Nominal p-value | 0.3104126 |
| FDR q-value | 0.8881972 |
| FWER p-Value | 0.994 |
| SYMBOL | TITLE | RANK IN GENE LIST | RANK METRIC SCORE | RUNNING ES | CORE ENRICHMENT | |
|---|---|---|---|---|---|---|
| 1 | Ccnd2 | Ccnd2 | 403 | 1.195 | 0.0910 | No |
| 2 | Dazl | Dazl | 731 | 0.975 | 0.1653 | No |
| 3 | Esr2 | Esr2 | 1307 | 0.780 | 0.2123 | No |
| 4 | Atm | Atm | 2484 | 0.579 | 0.2173 | No |
| 5 | Ptger2 | Ptger2 | 5177 | 0.346 | 0.1410 | No |
| 6 | Nrip1 | Nrip1 | 7860 | 0.205 | 0.0525 | No |
| 7 | Gdf9 | Gdf9 | 8585 | 0.174 | 0.0393 | No |
| 8 | Egr1 | Egr1 | 9645 | 0.132 | 0.0089 | No |
| 9 | Cebpb | Cebpb | 9913 | 0.122 | 0.0091 | No |
| 10 | Vdr | Vdr | 11656 | 0.055 | -0.0554 | No |
| 11 | Dmc1 | Dmc1 | 12540 | 0.026 | -0.0883 | No |
| 12 | Syne2 | Syne2 | 13105 | 0.005 | -0.1103 | No |
| 13 | Gja4 | Gja4 | 14791 | -0.056 | -0.1725 | No |
| 14 | Msh5 | Msh5 | 15928 | -0.096 | -0.2092 | No |
| 15 | Mlh1 | Mlh1 | 17269 | -0.147 | -0.2494 | No |
| 16 | Tbp | Tbp | 18910 | -0.218 | -0.2953 | Yes |
| 17 | Inha | Inha | 19118 | -0.226 | -0.2833 | Yes |
| 18 | Smad3 | Smad3 | 19749 | -0.258 | -0.2853 | Yes |
| 19 | Cdkn1b | Cdkn1b | 20233 | -0.283 | -0.2792 | Yes |
| 20 | Nr5a1 | Nr5a1 | 21199 | -0.339 | -0.2873 | Yes |
| 21 | Ncor1 | Ncor1 | 22354 | -0.428 | -0.2950 | Yes |
| 22 | Smpd1 | Smpd1 | 23666 | -0.591 | -0.2943 | Yes |
| 23 | Bmpr1b | Bmpr1b | 23992 | -0.663 | -0.2478 | Yes |
| 24 | Zp2 | Zp2 | 24344 | -0.771 | -0.1927 | Yes |
| 25 | Lhcgr | Lhcgr | 24464 | -0.818 | -0.1242 | Yes |
| 26 | Prlr | Prlr | 25040 | -1.672 | 0.0027 | Yes |