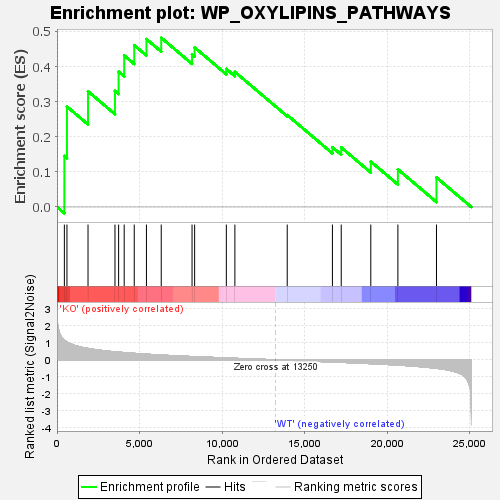
Profile of the Running ES Score & Positions of GeneSet Members on the Rank Ordered List
| Dataset | KO_vs_WT.KO_vs_WT.cls#KO_versus_WT.KO_vs_WT.cls#KO_versus_WT_repos |
| Phenotype | KO_vs_WT.cls#KO_versus_WT_repos |
| Upregulated in class | KO |
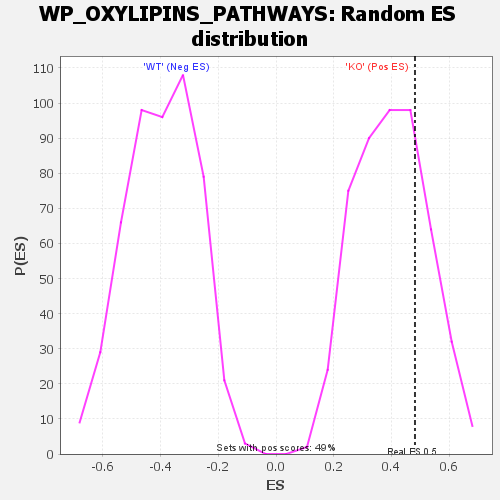
| GeneSet | WP_OXYLIPINS_PATHWAYS |
| Enrichment Score (ES) | 0.48173058 |
| Normalized Enrichment Score (NES) | 1.2046599 |
| Nominal p-value | 0.29531568 |
| FDR q-value | 0.96494365 |
| FWER p-Value | 0.982 |
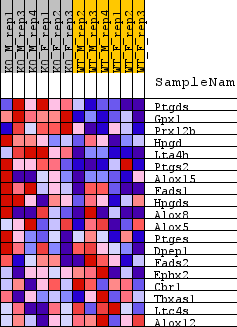
| SYMBOL | TITLE | RANK IN GENE LIST | RANK METRIC SCORE | RUNNING ES | CORE ENRICHMENT | |
|---|---|---|---|---|---|---|
| 1 | Ptgds | Ptgds | 446 | 1.155 | 0.1451 | Yes |
| 2 | Gpx1 | Gpx1 | 603 | 1.042 | 0.2858 | Yes |
| 3 | Prxl2b | Prxl2b | 1880 | 0.668 | 0.3292 | Yes |
| 4 | Hpgd | Hpgd | 3513 | 0.470 | 0.3305 | Yes |
| 5 | Lta4h | Lta4h | 3734 | 0.449 | 0.3851 | Yes |
| 6 | Ptgs2 | Ptgs2 | 4072 | 0.423 | 0.4314 | Yes |
| 7 | Alox15 | Alox15 | 4681 | 0.378 | 0.4605 | Yes |
| 8 | Fads1 | Fads1 | 5420 | 0.332 | 0.4779 | Yes |
| 9 | Hpgds | Hpgds | 6317 | 0.280 | 0.4817 | Yes |
| 10 | Alox8 | Alox8 | 8184 | 0.191 | 0.4343 | No |
| 11 | Alox5 | Alox5 | 8341 | 0.185 | 0.4542 | No |
| 12 | Ptges | Ptges | 10262 | 0.108 | 0.3929 | No |
| 13 | Dpep1 | Dpep1 | 10780 | 0.088 | 0.3847 | No |
| 14 | Fads2 | Fads2 | 13952 | -0.025 | 0.2618 | No |
| 15 | Ephx2 | Ephx2 | 16691 | -0.124 | 0.1702 | No |
| 16 | Cbr1 | Cbr1 | 17225 | -0.146 | 0.1695 | No |
| 17 | Tbxas1 | Tbxas1 | 19017 | -0.222 | 0.1294 | No |
| 18 | Ltc4s | Ltc4s | 20659 | -0.307 | 0.1072 | No |
| 19 | Alox12 | Alox12 | 22997 | -0.496 | 0.0841 | No |