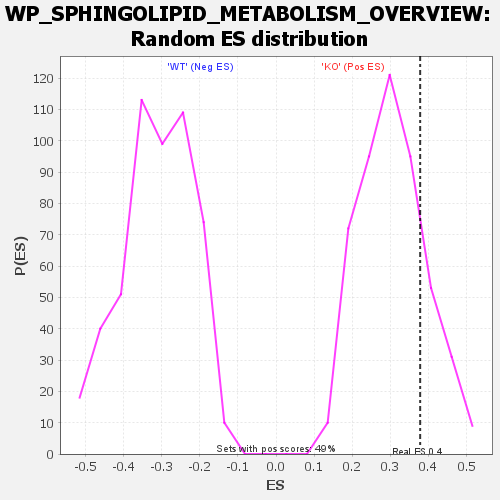
Profile of the Running ES Score & Positions of GeneSet Members on the Rank Ordered List
| Dataset | KO_vs_WT.KO_vs_WT.cls#KO_versus_WT.KO_vs_WT.cls#KO_versus_WT_repos |
| Phenotype | KO_vs_WT.cls#KO_versus_WT_repos |
| Upregulated in class | KO |
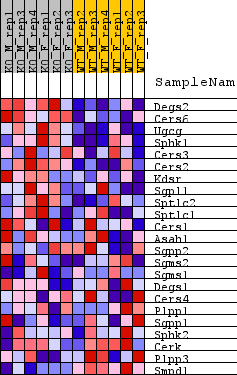
| GeneSet | WP_SPHINGOLIPID_METABOLISM_OVERVIEW |
| Enrichment Score (ES) | 0.378361 |
| Normalized Enrichment Score (NES) | 1.237565 |
| Nominal p-value | 0.19135803 |
| FDR q-value | 1.0 |
| FWER p-Value | 0.978 |
| SYMBOL | TITLE | RANK IN GENE LIST | RANK METRIC SCORE | RUNNING ES | CORE ENRICHMENT | |
|---|---|---|---|---|---|---|
| 1 | Degs2 | Degs2 | 443 | 1.160 | 0.1650 | Yes |
| 2 | Cers6 | Cers6 | 967 | 0.886 | 0.2837 | Yes |
| 3 | Ugcg | Ugcg | 1505 | 0.733 | 0.3777 | Yes |
| 4 | Sphk1 | Sphk1 | 3516 | 0.470 | 0.3716 | Yes |
| 5 | Cers3 | Cers3 | 6708 | 0.259 | 0.2852 | Yes |
| 6 | Cers2 | Cers2 | 6818 | 0.253 | 0.3208 | Yes |
| 7 | Kdsr | Kdsr | 7041 | 0.242 | 0.3500 | Yes |
| 8 | Sgpl1 | Sgpl1 | 7525 | 0.220 | 0.3654 | Yes |
| 9 | Sptlc2 | Sptlc2 | 7989 | 0.199 | 0.3784 | Yes |
| 10 | Sptlc1 | Sptlc1 | 10295 | 0.107 | 0.3033 | No |
| 11 | Cers1 | Cers1 | 10559 | 0.097 | 0.3081 | No |
| 12 | Asah1 | Asah1 | 10845 | 0.085 | 0.3102 | No |
| 13 | Sgpp2 | Sgpp2 | 11404 | 0.065 | 0.2981 | No |
| 14 | Sgms2 | Sgms2 | 11761 | 0.052 | 0.2921 | No |
| 15 | Sgms1 | Sgms1 | 12690 | 0.020 | 0.2582 | No |
| 16 | Degs1 | Degs1 | 14058 | -0.029 | 0.2083 | No |
| 17 | Cers4 | Cers4 | 14698 | -0.053 | 0.1912 | No |
| 18 | Plpp1 | Plpp1 | 16129 | -0.104 | 0.1505 | No |
| 19 | Sgpp1 | Sgpp1 | 16239 | -0.108 | 0.1631 | No |
| 20 | Sphk2 | Sphk2 | 16830 | -0.130 | 0.1601 | No |
| 21 | Cerk | Cerk | 17451 | -0.154 | 0.1597 | No |
| 22 | Plpp3 | Plpp3 | 21082 | -0.332 | 0.0673 | No |
| 23 | Smpd1 | Smpd1 | 23666 | -0.591 | 0.0574 | No |