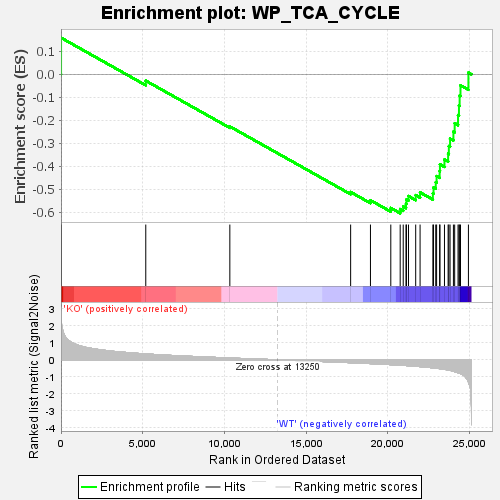
Profile of the Running ES Score & Positions of GeneSet Members on the Rank Ordered List
| Dataset | KO_vs_WT.KO_vs_WT.cls#KO_versus_WT.KO_vs_WT.cls#KO_versus_WT_repos |
| Phenotype | KO_vs_WT.cls#KO_versus_WT_repos |
| Upregulated in class | WT |
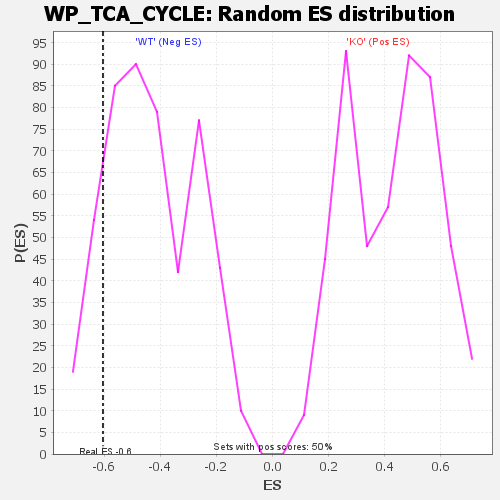
| GeneSet | WP_TCA_CYCLE |
| Enrichment Score (ES) | -0.6037954 |
| Normalized Enrichment Score (NES) | -1.4043028 |
| Nominal p-value | 0.13026053 |
| FDR q-value | 0.45814204 |
| FWER p-Value | 0.89 |
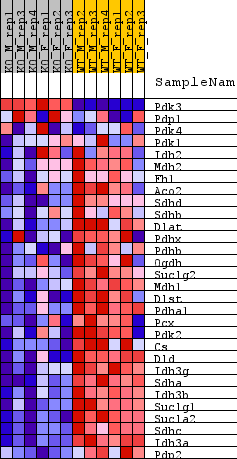
| SYMBOL | TITLE | RANK IN GENE LIST | RANK METRIC SCORE | RUNNING ES | CORE ENRICHMENT | |
|---|---|---|---|---|---|---|
| 1 | Pdk3 | Pdk3 | 4 | 2.767 | 0.1590 | No |
| 2 | Pdp1 | Pdp1 | 5185 | 0.346 | -0.0277 | No |
| 3 | Pdk4 | Pdk4 | 10327 | 0.106 | -0.2266 | No |
| 4 | Pdk1 | Pdk1 | 17716 | -0.165 | -0.5117 | No |
| 5 | Idh2 | Idh2 | 18928 | -0.218 | -0.5475 | No |
| 6 | Mdh2 | Mdh2 | 20172 | -0.280 | -0.5809 | No |
| 7 | Fh1 | Fh1 | 20746 | -0.312 | -0.5858 | Yes |
| 8 | Aco2 | Aco2 | 20932 | -0.322 | -0.5747 | Yes |
| 9 | Sdhd | Sdhd | 21102 | -0.334 | -0.5623 | Yes |
| 10 | Sdhb | Sdhb | 21130 | -0.335 | -0.5441 | Yes |
| 11 | Dlat | Dlat | 21254 | -0.343 | -0.5293 | Yes |
| 12 | Pdhx | Pdhx | 21695 | -0.375 | -0.5253 | Yes |
| 13 | Pdhb | Pdhb | 21963 | -0.395 | -0.5132 | Yes |
| 14 | Ogdh | Ogdh | 22746 | -0.468 | -0.5175 | Yes |
| 15 | Suclg2 | Suclg2 | 22786 | -0.473 | -0.4918 | Yes |
| 16 | Mdh1 | Mdh1 | 22922 | -0.490 | -0.4690 | Yes |
| 17 | Dlst | Dlst | 22974 | -0.495 | -0.4426 | Yes |
| 18 | Pdha1 | Pdha1 | 23160 | -0.515 | -0.4203 | Yes |
| 19 | Pcx | Pcx | 23179 | -0.518 | -0.3913 | Yes |
| 20 | Pdk2 | Pdk2 | 23455 | -0.557 | -0.3702 | Yes |
| 21 | Cs | Cs | 23678 | -0.593 | -0.3450 | Yes |
| 22 | Dld | Dld | 23723 | -0.603 | -0.3121 | Yes |
| 23 | Idh3g | Idh3g | 23797 | -0.618 | -0.2794 | Yes |
| 24 | Sdha | Sdha | 24002 | -0.667 | -0.2492 | Yes |
| 25 | Idh3b | Idh3b | 24079 | -0.688 | -0.2127 | Yes |
| 26 | Suclg1 | Suclg1 | 24285 | -0.753 | -0.1776 | Yes |
| 27 | Sucla2 | Sucla2 | 24342 | -0.770 | -0.1355 | Yes |
| 28 | Sdhc | Sdhc | 24383 | -0.786 | -0.0920 | Yes |
| 29 | Idh3a | Idh3a | 24435 | -0.805 | -0.0477 | Yes |
| 30 | Pdp2 | Pdp2 | 24920 | -1.295 | 0.0075 | Yes |