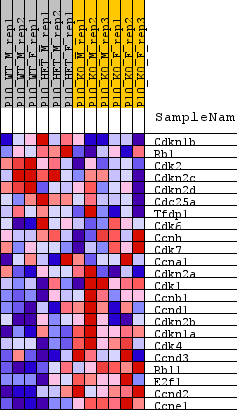
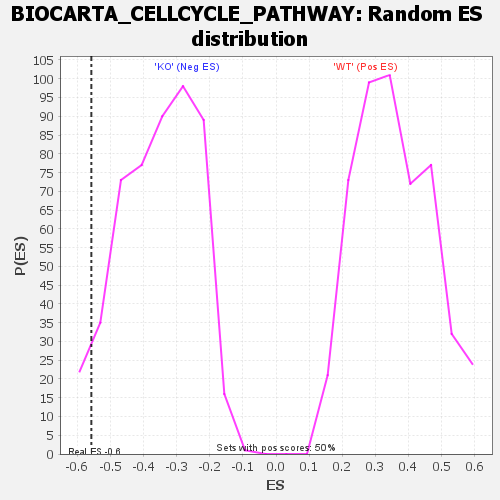
Profile of the Running ES Score & Positions of GeneSet Members on the Rank Ordered List
| Dataset | KO_vs_WTandHET.KO_vs_WTandHET.cls#WT_versus_KO |
| Phenotype | KO_vs_WTandHET.cls#WT_versus_KO |
| Upregulated in class | KO |
| GeneSet | BIOCARTA_CELLCYCLE_PATHWAY |
| Enrichment Score (ES) | -0.55803967 |
| Normalized Enrichment Score (NES) | -1.5735488 |
| Nominal p-value | 0.051896207 |
| FDR q-value | 0.24938409 |
| FWER p-Value | 0.542 |
| SYMBOL | TITLE | RANK IN GENE LIST | RANK METRIC SCORE | RUNNING ES | CORE ENRICHMENT | |
|---|---|---|---|---|---|---|
| 1 | Cdkn1b | Cdkn1b | 3591 | 0.394 | -0.1002 | No |
| 2 | Rb1 | Rb1 | 4551 | 0.315 | -0.0994 | No |
| 3 | Cdk2 | Cdk2 | 4769 | 0.298 | -0.0694 | No |
| 4 | Cdkn2c | Cdkn2c | 6307 | 0.207 | -0.1073 | No |
| 5 | Cdkn2d | Cdkn2d | 6928 | 0.177 | -0.1102 | No |
| 6 | Cdc25a | Cdc25a | 7384 | 0.156 | -0.1090 | No |
| 7 | Tfdp1 | Tfdp1 | 9602 | 0.064 | -0.1944 | No |
| 8 | Cdk6 | Cdk6 | 11294 | 0.004 | -0.2655 | No |
| 9 | Ccnh | Ccnh | 11374 | 0.001 | -0.2687 | No |
| 10 | Cdk7 | Cdk7 | 12834 | -0.051 | -0.3238 | No |
| 11 | Ccna1 | Ccna1 | 14516 | -0.115 | -0.3798 | No |
| 12 | Cdkn2a | Cdkn2a | 14811 | -0.128 | -0.3755 | No |
| 13 | Cdk1 | Cdk1 | 19126 | -0.330 | -0.5147 | Yes |
| 14 | Ccnb1 | Ccnb1 | 19364 | -0.345 | -0.4794 | Yes |
| 15 | Ccnd1 | Ccnd1 | 19677 | -0.368 | -0.4442 | Yes |
| 16 | Cdkn2b | Cdkn2b | 19762 | -0.373 | -0.3987 | Yes |
| 17 | Cdkn1a | Cdkn1a | 20276 | -0.417 | -0.3656 | Yes |
| 18 | Cdk4 | Cdk4 | 20534 | -0.442 | -0.3184 | Yes |
| 19 | Ccnd3 | Ccnd3 | 20721 | -0.463 | -0.2654 | Yes |
| 20 | Rbl1 | Rbl1 | 21303 | -0.533 | -0.2200 | Yes |
| 21 | E2f1 | E2f1 | 21369 | -0.542 | -0.1514 | Yes |
| 22 | Ccnd2 | Ccnd2 | 22162 | -0.693 | -0.0938 | Yes |
| 23 | Ccne1 | Ccne1 | 23202 | -1.192 | 0.0189 | Yes |