Profile of the Running ES Score & Positions of GeneSet Members on the Rank Ordered List
| Dataset | KO_vs_WTandHET.KO_vs_WTandHET.cls#WT_versus_KO |
| Phenotype | KO_vs_WTandHET.cls#WT_versus_KO |
| Upregulated in class | WT |
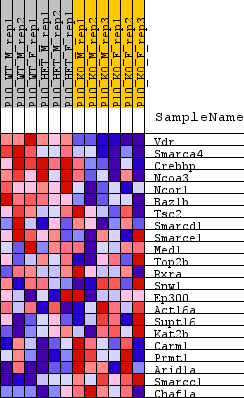
| GeneSet | BIOCARTA_VDR_PATHWAY |
| Enrichment Score (ES) | 0.409936 |
| Normalized Enrichment Score (NES) | 1.4528126 |
| Nominal p-value | 0.084812626 |
| FDR q-value | 0.514765 |
| FWER p-Value | 0.75 |
| SYMBOL | TITLE | RANK IN GENE LIST | RANK METRIC SCORE | RUNNING ES | CORE ENRICHMENT | |
|---|---|---|---|---|---|---|
| 1 | Vdr | Vdr | 245 | 1.808 | 0.2640 | Yes |
| 2 | Smarca4 | Smarca4 | 740 | 1.099 | 0.4099 | Yes |
| 3 | Crebbp | Crebbp | 4144 | 0.347 | 0.3185 | No |
| 4 | Ncoa3 | Ncoa3 | 4346 | 0.331 | 0.3602 | No |
| 5 | Ncor1 | Ncor1 | 4674 | 0.305 | 0.3926 | No |
| 6 | Baz1b | Baz1b | 7981 | 0.129 | 0.2722 | No |
| 7 | Tsc2 | Tsc2 | 8338 | 0.113 | 0.2744 | No |
| 8 | Smarcd1 | Smarcd1 | 9426 | 0.072 | 0.2393 | No |
| 9 | Smarce1 | Smarce1 | 9436 | 0.071 | 0.2497 | No |
| 10 | Med1 | Med1 | 9934 | 0.051 | 0.2365 | No |
| 11 | Top2b | Top2b | 10890 | 0.018 | 0.1988 | No |
| 12 | Rxra | Rxra | 11371 | 0.001 | 0.1787 | No |
| 13 | Snw1 | Snw1 | 11769 | -0.013 | 0.1638 | No |
| 14 | Ep300 | Ep300 | 12226 | -0.029 | 0.1488 | No |
| 15 | Actl6a | Actl6a | 13055 | -0.058 | 0.1226 | No |
| 16 | Supt16 | Supt16 | 14965 | -0.133 | 0.0620 | No |
| 17 | Kat2b | Kat2b | 16724 | -0.208 | 0.0193 | No |
| 18 | Carm1 | Carm1 | 16886 | -0.216 | 0.0452 | No |
| 19 | Prmt1 | Prmt1 | 19102 | -0.328 | 0.0012 | No |
| 20 | Arid1a | Arid1a | 19391 | -0.347 | 0.0417 | No |
| 21 | Smarcc1 | Smarcc1 | 20108 | -0.400 | 0.0722 | No |
| 22 | Chaf1a | Chaf1a | 21151 | -0.511 | 0.1057 | No |