Profile of the Running ES Score & Positions of GeneSet Members on the Rank Ordered List
| Dataset | KO_vs_WTandHET.KO_vs_WTandHET.cls#WT_versus_KO |
| Phenotype | KO_vs_WTandHET.cls#WT_versus_KO |
| Upregulated in class | WT |
| GeneSet | REACTOME_RAP1_SIGNALLING |
| Enrichment Score (ES) | 0.58652437 |
| Normalized Enrichment Score (NES) | 1.6872761 |
| Nominal p-value | 0.0 |
| FDR q-value | 0.30179676 |
| FWER p-Value | 0.686 |
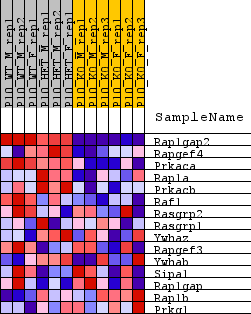
| SYMBOL | TITLE | RANK IN GENE LIST | RANK METRIC SCORE | RUNNING ES | CORE ENRICHMENT | |
|---|---|---|---|---|---|---|
| 1 | Rap1gap2 | Rap1gap2 | 22 | 3.376 | 0.5338 | Yes |
| 2 | Rapgef4 | Rapgef4 | 2549 | 0.516 | 0.5087 | Yes |
| 3 | Prkaca | Prkaca | 2879 | 0.466 | 0.5686 | Yes |
| 4 | Rap1a | Rap1a | 4690 | 0.304 | 0.5401 | Yes |
| 5 | Prkacb | Prkacb | 5110 | 0.275 | 0.5660 | Yes |
| 6 | Raf1 | Raf1 | 5546 | 0.246 | 0.5865 | Yes |
| 7 | Rasgrp2 | Rasgrp2 | 7829 | 0.135 | 0.5114 | No |
| 8 | Rasgrp1 | Rasgrp1 | 9143 | 0.083 | 0.4691 | No |
| 9 | Ywhaz | Ywhaz | 9745 | 0.058 | 0.4529 | No |
| 10 | Rapgef3 | Rapgef3 | 10497 | 0.031 | 0.4260 | No |
| 11 | Ywhab | Ywhab | 10624 | 0.027 | 0.4249 | No |
| 12 | Sipa1 | Sipa1 | 12360 | -0.033 | 0.3567 | No |
| 13 | Rap1gap | Rap1gap | 14412 | -0.111 | 0.2875 | No |
| 14 | Rap1b | Rap1b | 18282 | -0.284 | 0.1688 | No |
| 15 | Prkg1 | Prkg1 | 19680 | -0.368 | 0.1679 | No |