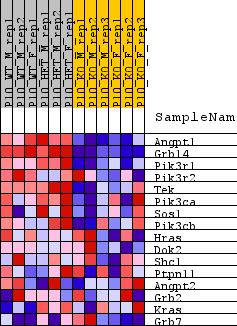
Profile of the Running ES Score & Positions of GeneSet Members on the Rank Ordered List
| Dataset | KO_vs_WTandHET.KO_vs_WTandHET.cls#WT_versus_KO |
| Phenotype | KO_vs_WTandHET.cls#WT_versus_KO |
| Upregulated in class | WT |
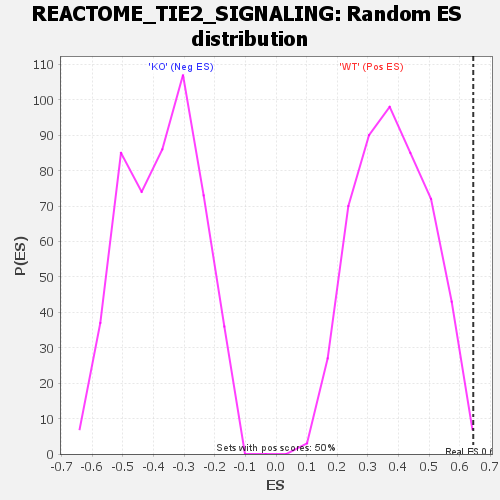
| GeneSet | REACTOME_TIE2_SIGNALING |
| Enrichment Score (ES) | 0.6443659 |
| Normalized Enrichment Score (NES) | 1.698254 |
| Nominal p-value | 0.002020202 |
| FDR q-value | 0.34750226 |
| FWER p-Value | 0.663 |
| SYMBOL | TITLE | RANK IN GENE LIST | RANK METRIC SCORE | RUNNING ES | CORE ENRICHMENT | |
|---|---|---|---|---|---|---|
| 1 | Angpt1 | Angpt1 | 277 | 1.733 | 0.3009 | Yes |
| 2 | Grb14 | Grb14 | 442 | 1.415 | 0.5492 | Yes |
| 3 | Pik3r1 | Pik3r1 | 1878 | 0.634 | 0.6030 | Yes |
| 4 | Pik3r2 | Pik3r2 | 4184 | 0.343 | 0.5674 | Yes |
| 5 | Tek | Tek | 4277 | 0.336 | 0.6241 | Yes |
| 6 | Pik3ca | Pik3ca | 5000 | 0.282 | 0.6444 | Yes |
| 7 | Sos1 | Sos1 | 6026 | 0.221 | 0.6408 | No |
| 8 | Pik3cb | Pik3cb | 8798 | 0.095 | 0.5408 | No |
| 9 | Hras | Hras | 10115 | 0.045 | 0.4932 | No |
| 10 | Dok2 | Dok2 | 10279 | 0.039 | 0.4934 | No |
| 11 | Shc1 | Shc1 | 10536 | 0.030 | 0.4880 | No |
| 12 | Ptpn11 | Ptpn11 | 11110 | 0.010 | 0.4656 | No |
| 13 | Angpt2 | Angpt2 | 11449 | -0.002 | 0.4516 | No |
| 14 | Grb2 | Grb2 | 11511 | -0.004 | 0.4497 | No |
| 15 | Kras | Kras | 11764 | -0.013 | 0.4413 | No |
| 16 | Grb7 | Grb7 | 19308 | -0.341 | 0.1837 | No |