Profile of the Running ES Score & Positions of GeneSet Members on the Rank Ordered List
| Dataset | KO_vs_WTandHET.KO_vs_WTandHET.cls#WT_versus_KO |
| Phenotype | KO_vs_WTandHET.cls#WT_versus_KO |
| Upregulated in class | WT |
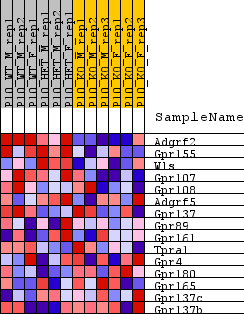
| GeneSet | WP_GPCRS_ORPHAN |
| Enrichment Score (ES) | 0.4587245 |
| Normalized Enrichment Score (NES) | 1.3382102 |
| Nominal p-value | 0.1494024 |
| FDR q-value | 0.39855242 |
| FWER p-Value | 0.894 |
| SYMBOL | TITLE | RANK IN GENE LIST | RANK METRIC SCORE | RUNNING ES | CORE ENRICHMENT | |
|---|---|---|---|---|---|---|
| 1 | Adgrf2 | Adgrf2 | 469 | 1.375 | 0.3235 | Yes |
| 2 | Gpr155 | Gpr155 | 1910 | 0.628 | 0.4195 | Yes |
| 3 | Wls | Wls | 3409 | 0.411 | 0.4587 | Yes |
| 4 | Gpr107 | Gpr107 | 5903 | 0.227 | 0.4099 | No |
| 5 | Gpr108 | Gpr108 | 6664 | 0.190 | 0.4251 | No |
| 6 | Adgrf5 | Adgrf5 | 7921 | 0.131 | 0.4048 | No |
| 7 | Gpr137 | Gpr137 | 9752 | 0.058 | 0.3419 | No |
| 8 | Gpr89 | Gpr89 | 10272 | 0.040 | 0.3298 | No |
| 9 | Gpr161 | Gpr161 | 10794 | 0.021 | 0.3130 | No |
| 10 | Tpra1 | Tpra1 | 10956 | 0.015 | 0.3101 | No |
| 11 | Gpr4 | Gpr4 | 13487 | -0.074 | 0.2215 | No |
| 12 | Gpr180 | Gpr180 | 14800 | -0.127 | 0.1978 | No |
| 13 | Gpr165 | Gpr165 | 16374 | -0.191 | 0.1789 | No |
| 14 | Gpr137c | Gpr137c | 17481 | -0.244 | 0.1931 | No |
| 15 | Gpr137b | Gpr137b | 18045 | -0.271 | 0.2371 | No |