Profile of the Running ES Score & Positions of GeneSet Members on the Rank Ordered List
| Dataset | KO_vs_WTandHET.KO_vs_WTandHET.cls#WT_versus_KO |
| Phenotype | KO_vs_WTandHET.cls#WT_versus_KO |
| Upregulated in class | KO |
| GeneSet | WP_STATIN_PATHWAY |
| Enrichment Score (ES) | -0.55365825 |
| Normalized Enrichment Score (NES) | -1.2439156 |
| Nominal p-value | 0.26209676 |
| FDR q-value | 0.5985291 |
| FWER p-Value | 0.961 |
| SYMBOL | TITLE | RANK IN GENE LIST | RANK METRIC SCORE | RUNNING ES | CORE ENRICHMENT | |
|---|---|---|---|---|---|---|
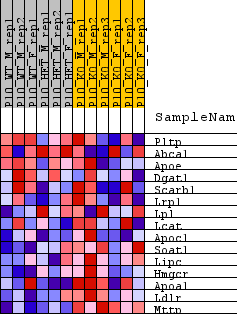
| 1 | Pltp | Pltp | 5158 | 0.273 | -0.1594 | No |
| 2 | Abca1 | Abca1 | 5876 | 0.228 | -0.1404 | No |
| 3 | Apoe | Apoe | 6505 | 0.197 | -0.1243 | No |
| 4 | Dgat1 | Dgat1 | 7408 | 0.155 | -0.1291 | No |
| 5 | Scarb1 | Scarb1 | 12411 | -0.035 | -0.3332 | No |
| 6 | Lrp1 | Lrp1 | 13842 | -0.088 | -0.3748 | No |
| 7 | Lpl | Lpl | 13893 | -0.090 | -0.3574 | No |
| 8 | Lcat | Lcat | 17911 | -0.265 | -0.4701 | No |
| 9 | Apoc1 | Apoc1 | 19888 | -0.383 | -0.4709 | Yes |
| 10 | Soat1 | Soat1 | 19946 | -0.388 | -0.3895 | Yes |
| 11 | Lipc | Lipc | 20349 | -0.423 | -0.3151 | Yes |
| 12 | Hmgcr | Hmgcr | 20401 | -0.429 | -0.2247 | Yes |
| 13 | Apoa1 | Apoa1 | 20831 | -0.474 | -0.1404 | Yes |
| 14 | Ldlr | Ldlr | 21709 | -0.597 | -0.0486 | Yes |
| 15 | Mttp | Mttp | 21764 | -0.605 | 0.0798 | Yes |