Profile of the Running ES Score & Positions of GeneSet Members on the Rank Ordered List
| Dataset | KO_vs_WTandHET.KO_vs_WTandHET.cls#WT_versus_KO |
| Phenotype | KO_vs_WTandHET.cls#WT_versus_KO |
| Upregulated in class | WT |
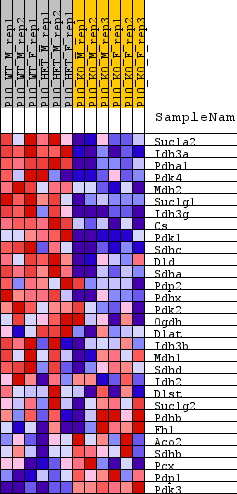
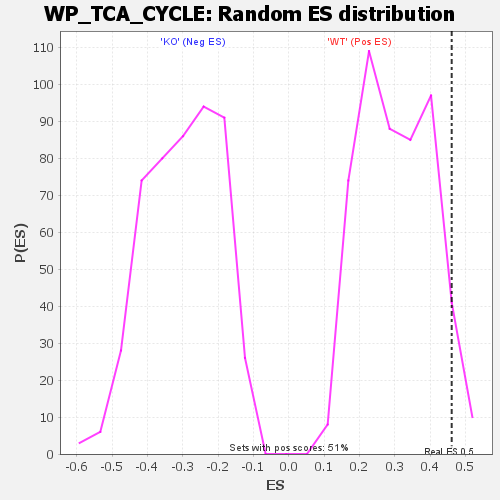
| GeneSet | WP_TCA_CYCLE |
| Enrichment Score (ES) | 0.46135488 |
| Normalized Enrichment Score (NES) | 1.5118574 |
| Nominal p-value | 0.05078125 |
| FDR q-value | 0.43219277 |
| FWER p-Value | 0.684 |
| SYMBOL | TITLE | RANK IN GENE LIST | RANK METRIC SCORE | RUNNING ES | CORE ENRICHMENT | |
|---|---|---|---|---|---|---|
| 1 | Sucla2 | Sucla2 | 1378 | 0.768 | 0.0075 | Yes |
| 2 | Idh3a | Idh3a | 1426 | 0.751 | 0.0698 | Yes |
| 3 | Pdha1 | Pdha1 | 1572 | 0.711 | 0.1246 | Yes |
| 4 | Pdk4 | Pdk4 | 1669 | 0.686 | 0.1794 | Yes |
| 5 | Mdh2 | Mdh2 | 2299 | 0.562 | 0.2009 | Yes |
| 6 | Suclg1 | Suclg1 | 2551 | 0.516 | 0.2345 | Yes |
| 7 | Idh3g | Idh3g | 2713 | 0.489 | 0.2696 | Yes |
| 8 | Cs | Cs | 2877 | 0.466 | 0.3027 | Yes |
| 9 | Pdk1 | Pdk1 | 3361 | 0.416 | 0.3179 | Yes |
| 10 | Sdhc | Sdhc | 3708 | 0.383 | 0.3361 | Yes |
| 11 | Dld | Dld | 3822 | 0.373 | 0.3633 | Yes |
| 12 | Sdha | Sdha | 3860 | 0.371 | 0.3935 | Yes |
| 13 | Pdp2 | Pdp2 | 4227 | 0.339 | 0.4071 | Yes |
| 14 | Pdhx | Pdhx | 4292 | 0.335 | 0.4331 | Yes |
| 15 | Pdk2 | Pdk2 | 4301 | 0.334 | 0.4614 | Yes |
| 16 | Ogdh | Ogdh | 5036 | 0.280 | 0.4542 | No |
| 17 | Dlat | Dlat | 6354 | 0.204 | 0.4160 | No |
| 18 | Idh3b | Idh3b | 7734 | 0.140 | 0.3696 | No |
| 19 | Mdh1 | Mdh1 | 8090 | 0.124 | 0.3652 | No |
| 20 | Sdhd | Sdhd | 8760 | 0.097 | 0.3452 | No |
| 21 | Idh2 | Idh2 | 8879 | 0.093 | 0.3481 | No |
| 22 | Dlst | Dlst | 9626 | 0.063 | 0.3219 | No |
| 23 | Suclg2 | Suclg2 | 10388 | 0.035 | 0.2928 | No |
| 24 | Pdhb | Pdhb | 13976 | -0.094 | 0.1489 | No |
| 25 | Fh1 | Fh1 | 15707 | -0.163 | 0.0897 | No |
| 26 | Aco2 | Aco2 | 15908 | -0.171 | 0.0959 | No |
| 27 | Sdhb | Sdhb | 16414 | -0.193 | 0.0910 | No |
| 28 | Pcx | Pcx | 18818 | -0.311 | 0.0159 | No |
| 29 | Pdp1 | Pdp1 | 22100 | -0.679 | -0.0648 | No |
| 30 | Pdk3 | Pdk3 | 23408 | -1.520 | 0.0102 | No |