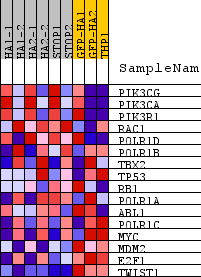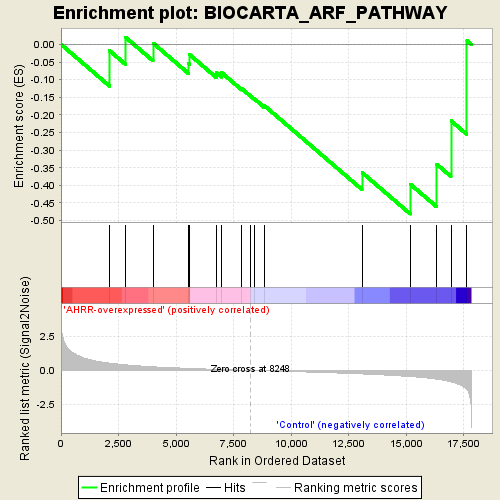
Profile of the Running ES Score & Positions of GeneSet Members on the Rank Ordered List
| Dataset | normalized_counts_per_kilobase_for_GSEA.class.cls #AHRR-overexpressed_versus_Control |
| Phenotype | class.cls#AHRR-overexpressed_versus_Control |
| Upregulated in class | Control |
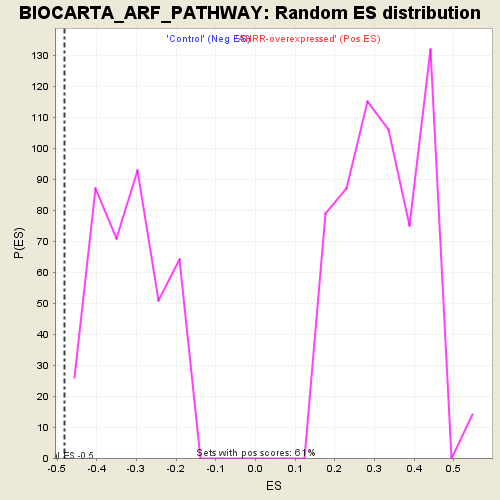
| GeneSet | BIOCARTA_ARF_PATHWAY |
| Enrichment Score (ES) | -0.4813332 |
| Normalized Enrichment Score (NES) | -1.5236728 |
| Nominal p-value | 0.0 |
| FDR q-value | 1.0 |
| FWER p-Value | 0.871 |
| PROBE | DESCRIPTION (from dataset) | GENE SYMBOL | GENE_TITLE | RANK IN GENE LIST | RANK METRIC SCORE | RUNNING ES | CORE ENRICHMENT | |
|---|---|---|---|---|---|---|---|---|
| 1 | PIK3CG | na | 2112 | 0.537 | -0.0181 | No | ||
| 2 | PIK3CA | na | 2813 | 0.412 | 0.0197 | No | ||
| 3 | PIK3R1 | na | 3998 | 0.271 | 0.0039 | No | ||
| 4 | RAC1 | na | 5545 | 0.151 | -0.0545 | No | ||
| 5 | POLR1D | na | 5578 | 0.149 | -0.0284 | No | ||
| 6 | POLR1B | na | 6768 | 0.078 | -0.0805 | No | ||
| 7 | TBX2 | na | 6986 | 0.066 | -0.0804 | No | ||
| 8 | TP53 | na | 7860 | 0.019 | -0.1258 | No | ||
| 9 | RB1 | na | 8213 | 0.002 | -0.1452 | No | ||
| 10 | POLR1A | na | 8401 | -0.007 | -0.1544 | No | ||
| 11 | ABL1 | na | 8829 | -0.027 | -0.1732 | No | ||
| 12 | POLR1C | na | 13084 | -0.259 | -0.3635 | No | ||
| 13 | MYC | na | 15185 | -0.453 | -0.3967 | Yes | ||
| 14 | MDM2 | na | 16337 | -0.647 | -0.3403 | Yes | ||
| 15 | E2F1 | na | 16952 | -0.845 | -0.2168 | Yes | ||
| 16 | TWIST1 | na | 17645 | -1.426 | 0.0110 | Yes |