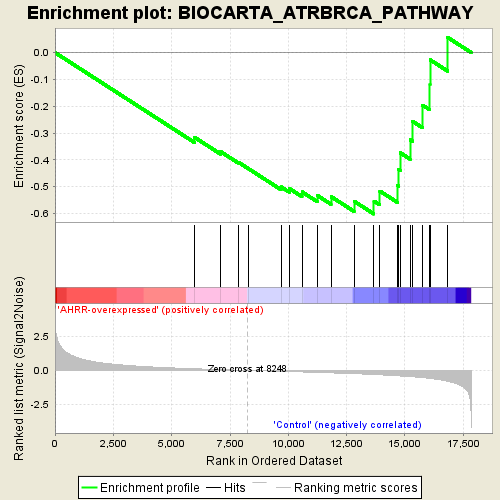
Profile of the Running ES Score & Positions of GeneSet Members on the Rank Ordered List
| Dataset | normalized_counts_per_kilobase_for_GSEA.class.cls #AHRR-overexpressed_versus_Control |
| Phenotype | class.cls#AHRR-overexpressed_versus_Control |
| Upregulated in class | Control |
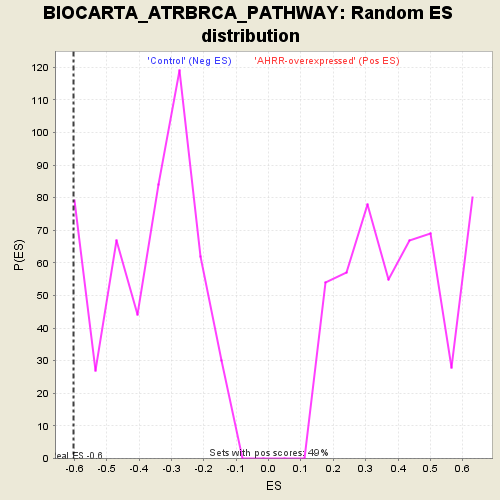
| GeneSet | BIOCARTA_ATRBRCA_PATHWAY |
| Enrichment Score (ES) | -0.6020911 |
| Normalized Enrichment Score (NES) | -1.5961733 |
| Nominal p-value | 0.0625 |
| FDR q-value | 1.0 |
| FWER p-Value | 0.714 |
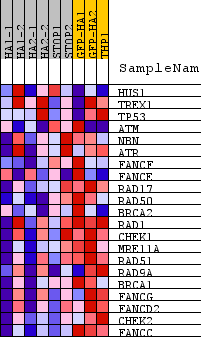
| PROBE | DESCRIPTION (from dataset) | GENE SYMBOL | GENE_TITLE | RANK IN GENE LIST | RANK METRIC SCORE | RUNNING ES | CORE ENRICHMENT | |
|---|---|---|---|---|---|---|---|---|
| 1 | HUS1 | na | 5974 | 0.124 | -0.3157 | No | ||
| 2 | TREX1 | na | 7099 | 0.059 | -0.3695 | No | ||
| 3 | TP53 | na | 7860 | 0.019 | -0.4091 | No | ||
| 4 | ATM | na | 8283 | -0.001 | -0.4326 | No | ||
| 5 | NBN | na | 9692 | -0.068 | -0.5009 | No | ||
| 6 | ATR | na | 10040 | -0.086 | -0.5068 | No | ||
| 7 | FANCF | na | 10589 | -0.114 | -0.5196 | No | ||
| 8 | FANCE | na | 11239 | -0.149 | -0.5325 | No | ||
| 9 | RAD17 | na | 11833 | -0.182 | -0.5370 | No | ||
| 10 | RAD50 | na | 12822 | -0.242 | -0.5544 | Yes | ||
| 11 | BRCA2 | na | 13673 | -0.306 | -0.5539 | Yes | ||
| 12 | RAD1 | na | 13925 | -0.327 | -0.5164 | Yes | ||
| 13 | CHEK1 | na | 14674 | -0.399 | -0.4955 | Yes | ||
| 14 | MRE11A | na | 14736 | -0.406 | -0.4350 | Yes | ||
| 15 | RAD51 | na | 14799 | -0.412 | -0.3736 | Yes | ||
| 16 | RAD9A | na | 15225 | -0.459 | -0.3252 | Yes | ||
| 17 | BRCA1 | na | 15329 | -0.472 | -0.2565 | Yes | ||
| 18 | FANCG | na | 15754 | -0.536 | -0.1959 | Yes | ||
| 19 | FANCD2 | na | 16074 | -0.593 | -0.1202 | Yes | ||
| 20 | CHEK2 | na | 16077 | -0.594 | -0.0267 | Yes | ||
| 21 | FANCC | na | 16836 | -0.797 | 0.0564 | Yes |