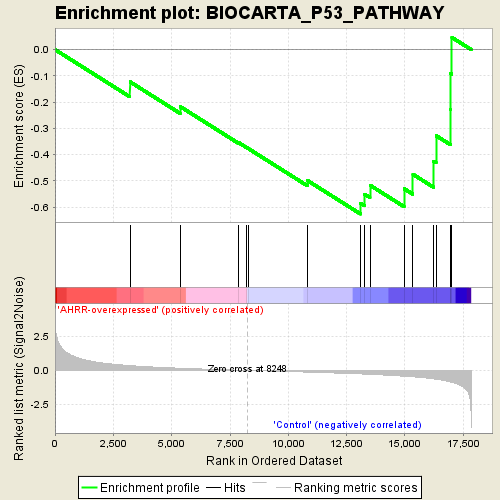
Profile of the Running ES Score & Positions of GeneSet Members on the Rank Ordered List
| Dataset | normalized_counts_per_kilobase_for_GSEA.class.cls #AHRR-overexpressed_versus_Control |
| Phenotype | class.cls#AHRR-overexpressed_versus_Control |
| Upregulated in class | Control |
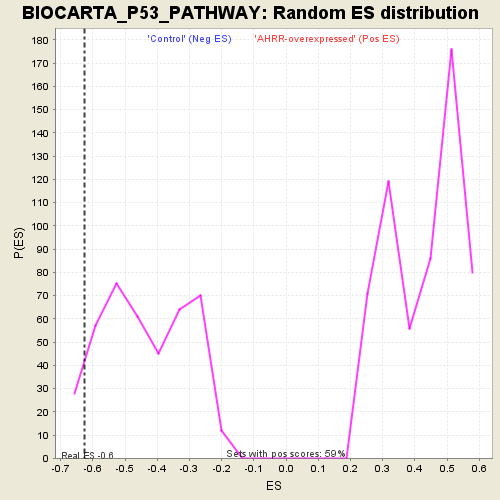
| GeneSet | BIOCARTA_P53_PATHWAY |
| Enrichment Score (ES) | -0.62674093 |
| Normalized Enrichment Score (NES) | -1.4334911 |
| Nominal p-value | 0.041262135 |
| FDR q-value | 1.0 |
| FWER p-Value | 0.991 |
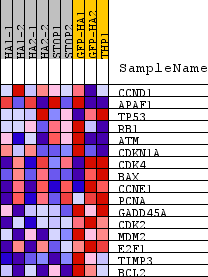
| PROBE | DESCRIPTION (from dataset) | GENE SYMBOL | GENE_TITLE | RANK IN GENE LIST | RANK METRIC SCORE | RUNNING ES | CORE ENRICHMENT | |
|---|---|---|---|---|---|---|---|---|
| 1 | CCND1 | na | 3212 | 0.359 | -0.1226 | No | ||
| 2 | APAF1 | na | 5363 | 0.164 | -0.2170 | No | ||
| 3 | TP53 | na | 7860 | 0.019 | -0.3540 | No | ||
| 4 | RB1 | na | 8213 | 0.002 | -0.3734 | No | ||
| 5 | ATM | na | 8283 | -0.001 | -0.3771 | No | ||
| 6 | CDKN1A | na | 10829 | -0.127 | -0.4995 | No | ||
| 7 | CDK4 | na | 13098 | -0.259 | -0.5851 | Yes | ||
| 8 | BAX | na | 13274 | -0.273 | -0.5511 | Yes | ||
| 9 | CCNE1 | na | 13504 | -0.293 | -0.5170 | Yes | ||
| 10 | PCNA | na | 14965 | -0.429 | -0.5301 | Yes | ||
| 11 | GADD45A | na | 15344 | -0.474 | -0.4753 | Yes | ||
| 12 | CDK2 | na | 16222 | -0.618 | -0.4254 | Yes | ||
| 13 | MDM2 | na | 16337 | -0.647 | -0.3280 | Yes | ||
| 14 | E2F1 | na | 16952 | -0.845 | -0.2269 | Yes | ||
| 15 | TIMP3 | na | 16960 | -0.850 | -0.0909 | Yes | ||
| 16 | BCL2 | na | 17015 | -0.875 | 0.0463 | Yes |