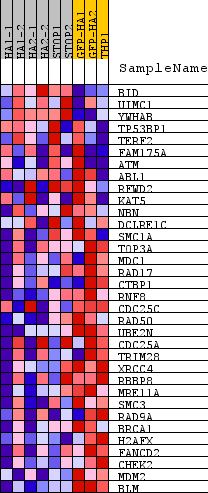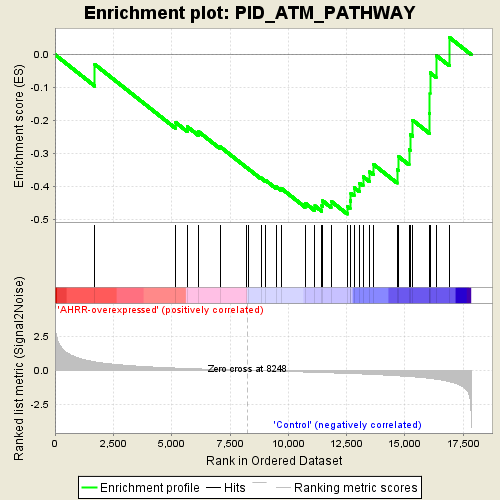
Profile of the Running ES Score & Positions of GeneSet Members on the Rank Ordered List
| Dataset | normalized_counts_per_kilobase_for_GSEA.class.cls #AHRR-overexpressed_versus_Control |
| Phenotype | class.cls#AHRR-overexpressed_versus_Control |
| Upregulated in class | Control |
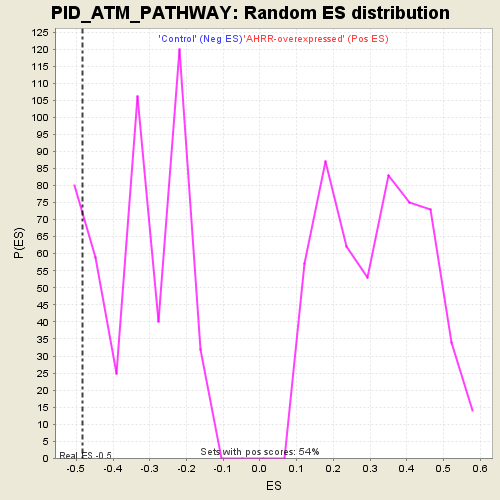
| GeneSet | PID_ATM_PATHWAY |
| Enrichment Score (ES) | -0.48422143 |
| Normalized Enrichment Score (NES) | -1.439028 |
| Nominal p-value | 0.103896104 |
| FDR q-value | 1.0 |
| FWER p-Value | 0.991 |
| PROBE | DESCRIPTION (from dataset) | GENE SYMBOL | GENE_TITLE | RANK IN GENE LIST | RANK METRIC SCORE | RUNNING ES | CORE ENRICHMENT | |
|---|---|---|---|---|---|---|---|---|
| 1 | BID | na | 1705 | 0.631 | -0.0298 | No | ||
| 2 | UIMC1 | na | 5176 | 0.176 | -0.2062 | No | ||
| 3 | YWHAB | na | 5668 | 0.144 | -0.2187 | No | ||
| 4 | TP53BP1 | na | 6142 | 0.114 | -0.2333 | No | ||
| 5 | TERF2 | na | 7084 | 0.059 | -0.2800 | No | ||
| 6 | FAM175A | na | 8212 | 0.002 | -0.3431 | No | ||
| 7 | ATM | na | 8283 | -0.001 | -0.3469 | No | ||
| 8 | ABL1 | na | 8829 | -0.027 | -0.3746 | No | ||
| 9 | RFWD2 | na | 9014 | -0.037 | -0.3811 | No | ||
| 10 | KAT5 | na | 9483 | -0.058 | -0.4013 | No | ||
| 11 | NBN | na | 9692 | -0.068 | -0.4059 | No | ||
| 12 | DCLRE1C | na | 10720 | -0.121 | -0.4509 | No | ||
| 13 | SMC1A | na | 11142 | -0.143 | -0.4596 | No | ||
| 14 | TOP3A | na | 11439 | -0.161 | -0.4594 | No | ||
| 15 | MDC1 | na | 11471 | -0.163 | -0.4441 | No | ||
| 16 | RAD17 | na | 11833 | -0.182 | -0.4453 | No | ||
| 17 | CTBP1 | na | 12527 | -0.222 | -0.4610 | Yes | ||
| 18 | RNF8 | na | 12649 | -0.229 | -0.4439 | Yes | ||
| 19 | CDC25C | na | 12684 | -0.232 | -0.4216 | Yes | ||
| 20 | RAD50 | na | 12822 | -0.242 | -0.4041 | Yes | ||
| 21 | UBE2N | na | 13058 | -0.257 | -0.3904 | Yes | ||
| 22 | CDC25A | na | 13205 | -0.268 | -0.3706 | Yes | ||
| 23 | TRIM28 | na | 13493 | -0.292 | -0.3562 | Yes | ||
| 24 | XRCC4 | na | 13649 | -0.304 | -0.3332 | Yes | ||
| 25 | RBBP8 | na | 14663 | -0.397 | -0.3485 | Yes | ||
| 26 | MRE11A | na | 14736 | -0.406 | -0.3102 | Yes | ||
| 27 | SMC3 | na | 15178 | -0.452 | -0.2877 | Yes | ||
| 28 | RAD9A | na | 15225 | -0.459 | -0.2424 | Yes | ||
| 29 | BRCA1 | na | 15329 | -0.472 | -0.1988 | Yes | ||
| 30 | H2AFX | na | 16051 | -0.588 | -0.1778 | Yes | ||
| 31 | FANCD2 | na | 16074 | -0.593 | -0.1171 | Yes | ||
| 32 | CHEK2 | na | 16077 | -0.594 | -0.0551 | Yes | ||
| 33 | MDM2 | na | 16337 | -0.647 | -0.0020 | Yes | ||
| 34 | BLM | na | 16910 | -0.827 | 0.0523 | Yes |