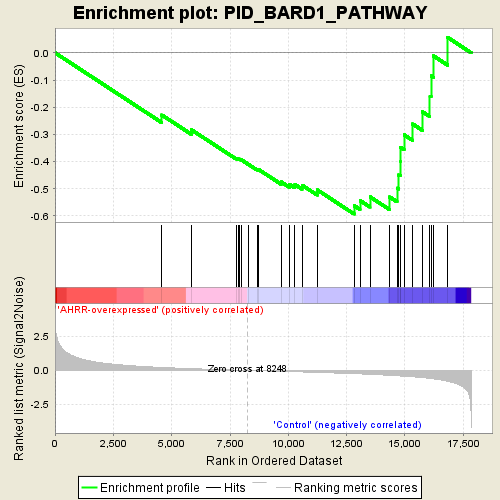
Profile of the Running ES Score & Positions of GeneSet Members on the Rank Ordered List
| Dataset | normalized_counts_per_kilobase_for_GSEA.class.cls #AHRR-overexpressed_versus_Control |
| Phenotype | class.cls#AHRR-overexpressed_versus_Control |
| Upregulated in class | Control |
| GeneSet | PID_BARD1_PATHWAY |
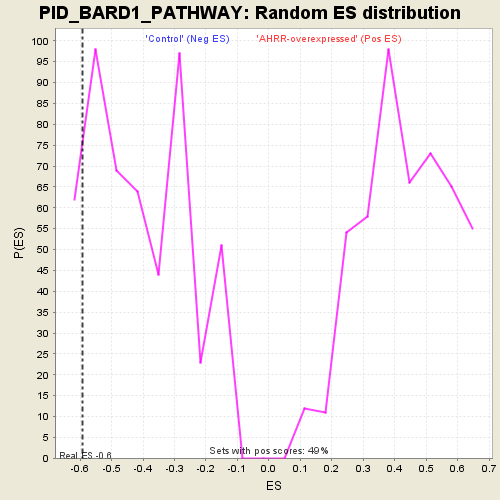
| Enrichment Score (ES) | -0.59276843 |
| Normalized Enrichment Score (NES) | -1.4502603 |
| Nominal p-value | 0.1003937 |
| FDR q-value | 1.0 |
| FWER p-Value | 0.971 |
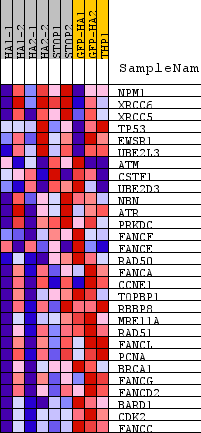
| PROBE | DESCRIPTION (from dataset) | GENE SYMBOL | GENE_TITLE | RANK IN GENE LIST | RANK METRIC SCORE | RUNNING ES | CORE ENRICHMENT | |
|---|---|---|---|---|---|---|---|---|
| 1 | NPM1 | na | 4576 | 0.221 | -0.2286 | No | ||
| 2 | XRCC6 | na | 5847 | 0.132 | -0.2830 | No | ||
| 3 | XRCC5 | na | 7765 | 0.025 | -0.3875 | No | ||
| 4 | TP53 | na | 7860 | 0.019 | -0.3903 | No | ||
| 5 | EWSR1 | na | 7902 | 0.017 | -0.3904 | No | ||
| 6 | UBE2L3 | na | 7974 | 0.013 | -0.3927 | No | ||
| 7 | ATM | na | 8283 | -0.001 | -0.4098 | No | ||
| 8 | CSTF1 | na | 8666 | -0.020 | -0.4287 | No | ||
| 9 | UBE2D3 | na | 8742 | -0.023 | -0.4300 | No | ||
| 10 | NBN | na | 9692 | -0.068 | -0.4746 | No | ||
| 11 | ATR | na | 10040 | -0.086 | -0.4830 | No | ||
| 12 | PRKDC | na | 10283 | -0.098 | -0.4840 | No | ||
| 13 | FANCF | na | 10589 | -0.114 | -0.4866 | No | ||
| 14 | FANCE | na | 11239 | -0.149 | -0.5040 | No | ||
| 15 | RAD50 | na | 12822 | -0.242 | -0.5619 | Yes | ||
| 16 | FANCA | na | 13076 | -0.258 | -0.5431 | Yes | ||
| 17 | CCNE1 | na | 13504 | -0.293 | -0.5296 | Yes | ||
| 18 | TOPBP1 | na | 14344 | -0.365 | -0.5300 | Yes | ||
| 19 | RBBP8 | na | 14663 | -0.397 | -0.4970 | Yes | ||
| 20 | MRE11A | na | 14736 | -0.406 | -0.4492 | Yes | ||
| 21 | RAD51 | na | 14799 | -0.412 | -0.4000 | Yes | ||
| 22 | FANCL | na | 14805 | -0.412 | -0.3476 | Yes | ||
| 23 | PCNA | na | 14965 | -0.429 | -0.3016 | Yes | ||
| 24 | BRCA1 | na | 15329 | -0.472 | -0.2615 | Yes | ||
| 25 | FANCG | na | 15754 | -0.536 | -0.2168 | Yes | ||
| 26 | FANCD2 | na | 16074 | -0.593 | -0.1588 | Yes | ||
| 27 | BARD1 | na | 16123 | -0.599 | -0.0848 | Yes | ||
| 28 | CDK2 | na | 16222 | -0.618 | -0.0112 | Yes | ||
| 29 | FANCC | na | 16836 | -0.797 | 0.0564 | Yes |