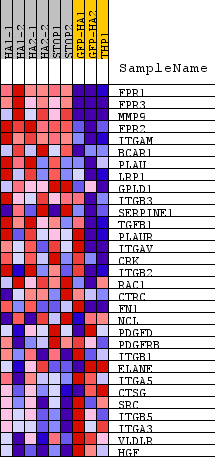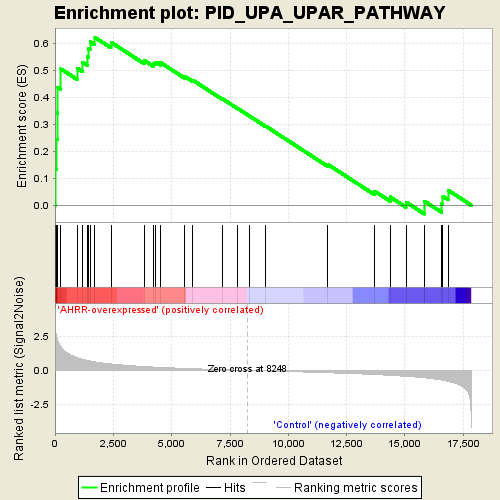
Profile of the Running ES Score & Positions of GeneSet Members on the Rank Ordered List
| Dataset | normalized_counts_per_kilobase_for_GSEA.class.cls #AHRR-overexpressed_versus_Control |
| Phenotype | class.cls#AHRR-overexpressed_versus_Control |
| Upregulated in class | AHRR-overexpressed |
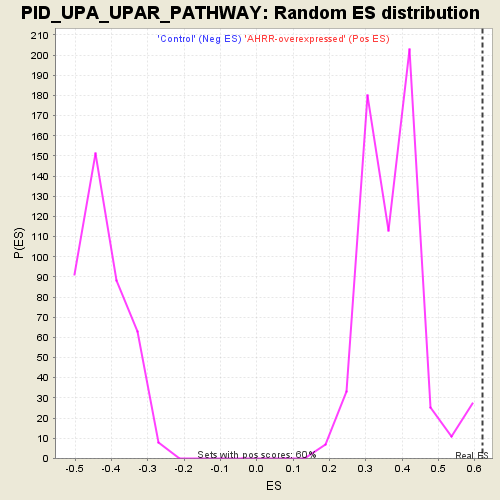
| GeneSet | PID_UPA_UPAR_PATHWAY |
| Enrichment Score (ES) | 0.6215418 |
| Normalized Enrichment Score (NES) | 1.6380011 |
| Nominal p-value | 0.0 |
| FDR q-value | 0.2702287 |
| FWER p-Value | 0.683 |
| PROBE | DESCRIPTION (from dataset) | GENE SYMBOL | GENE_TITLE | RANK IN GENE LIST | RANK METRIC SCORE | RUNNING ES | CORE ENRICHMENT | |
|---|---|---|---|---|---|---|---|---|
| 1 | FPR1 | na | 18 | 3.109 | 0.1344 | Yes | ||
| 2 | FPR3 | na | 63 | 2.566 | 0.2436 | Yes | ||
| 3 | MMP9 | na | 100 | 2.304 | 0.3419 | Yes | ||
| 4 | FPR2 | na | 120 | 2.184 | 0.4360 | Yes | ||
| 5 | ITGAM | na | 250 | 1.750 | 0.5049 | Yes | ||
| 6 | BCAR1 | na | 943 | 0.952 | 0.5075 | Yes | ||
| 7 | PLAU | na | 1185 | 0.819 | 0.5296 | Yes | ||
| 8 | LRP1 | na | 1399 | 0.735 | 0.5497 | Yes | ||
| 9 | GPLD1 | na | 1433 | 0.721 | 0.5792 | Yes | ||
| 10 | ITGB3 | na | 1500 | 0.696 | 0.6059 | Yes | ||
| 11 | SERPINE1 | na | 1710 | 0.630 | 0.6215 | Yes | ||
| 12 | TGFB1 | na | 2399 | 0.481 | 0.6039 | No | ||
| 13 | PLAUR | na | 3827 | 0.289 | 0.5363 | No | ||
| 14 | ITGAV | na | 4238 | 0.247 | 0.5241 | No | ||
| 15 | CRK | na | 4316 | 0.240 | 0.5302 | No | ||
| 16 | ITGB2 | na | 4515 | 0.226 | 0.5289 | No | ||
| 17 | RAC1 | na | 5545 | 0.151 | 0.4777 | No | ||
| 18 | CTRC | na | 5898 | 0.128 | 0.4636 | No | ||
| 19 | FN1 | na | 7172 | 0.055 | 0.3945 | No | ||
| 20 | NCL | na | 7829 | 0.021 | 0.3586 | No | ||
| 21 | PDGFD | na | 8326 | -0.003 | 0.3309 | No | ||
| 22 | PDGFRB | na | 9025 | -0.037 | 0.2933 | No | ||
| 23 | ITGB1 | na | 11695 | -0.175 | 0.1511 | No | ||
| 24 | ELANE | na | 13697 | -0.308 | 0.0521 | No | ||
| 25 | ITGA5 | na | 14366 | -0.367 | 0.0306 | No | ||
| 26 | CTSG | na | 15047 | -0.438 | 0.0115 | No | ||
| 27 | SRC | na | 15836 | -0.548 | -0.0089 | No | ||
| 28 | ITGB5 | na | 15837 | -0.548 | 0.0150 | No | ||
| 29 | ITGA3 | na | 16565 | -0.706 | 0.0049 | No | ||
| 30 | VLDLR | na | 16630 | -0.725 | 0.0329 | No | ||
| 31 | HGF | na | 16852 | -0.804 | 0.0555 | No |