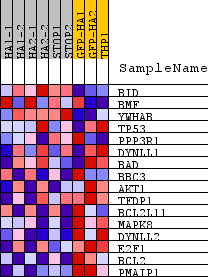
Profile of the Running ES Score & Positions of GeneSet Members on the Rank Ordered List
| Dataset | normalized_counts_per_kilobase_for_GSEA.class.cls #AHRR-overexpressed_versus_Control |
| Phenotype | class.cls#AHRR-overexpressed_versus_Control |
| Upregulated in class | Control |
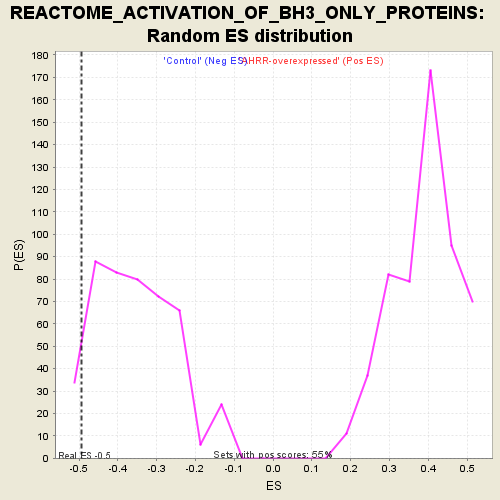
| GeneSet | REACTOME_ACTIVATION_OF_BH3_ONLY_PROTEINS |
| Enrichment Score (ES) | -0.49406242 |
| Normalized Enrichment Score (NES) | -1.3940719 |
| Nominal p-value | 0.022075055 |
| FDR q-value | 1.0 |
| FWER p-Value | 0.991 |
| PROBE | DESCRIPTION (from dataset) | GENE SYMBOL | GENE_TITLE | RANK IN GENE LIST | RANK METRIC SCORE | RUNNING ES | CORE ENRICHMENT | |
|---|---|---|---|---|---|---|---|---|
| 1 | BID | na | 1705 | 0.631 | 0.0109 | No | ||
| 2 | BMF | na | 3476 | 0.325 | -0.0334 | No | ||
| 3 | YWHAB | na | 5668 | 0.144 | -0.1320 | No | ||
| 4 | TP53 | na | 7860 | 0.019 | -0.2517 | No | ||
| 5 | PPP3R1 | na | 8858 | -0.029 | -0.3028 | No | ||
| 6 | DYNLL1 | na | 10217 | -0.095 | -0.3629 | No | ||
| 7 | BAD | na | 10799 | -0.125 | -0.3744 | No | ||
| 8 | BBC3 | na | 12933 | -0.248 | -0.4522 | Yes | ||
| 9 | AKT1 | na | 13100 | -0.260 | -0.4177 | Yes | ||
| 10 | TFDP1 | na | 14006 | -0.335 | -0.4119 | Yes | ||
| 11 | BCL2L11 | na | 14091 | -0.341 | -0.3590 | Yes | ||
| 12 | MAPK8 | na | 14101 | -0.343 | -0.3016 | Yes | ||
| 13 | DYNLL2 | na | 14385 | -0.368 | -0.2553 | Yes | ||
| 14 | E2F1 | na | 16952 | -0.845 | -0.2566 | Yes | ||
| 15 | BCL2 | na | 17015 | -0.875 | -0.1124 | Yes | ||
| 16 | PMAIP1 | na | 17141 | -0.940 | 0.0393 | Yes |