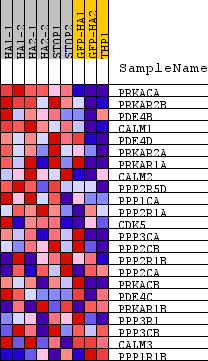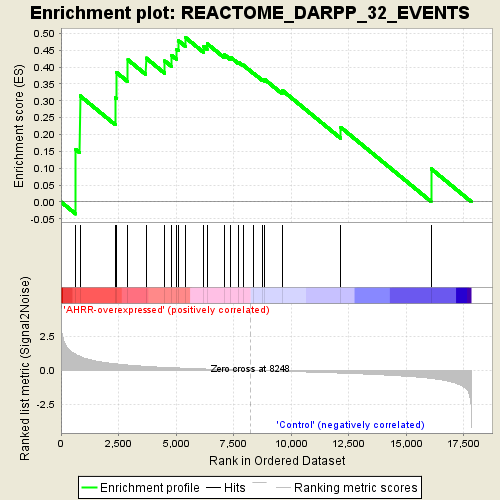
Profile of the Running ES Score & Positions of GeneSet Members on the Rank Ordered List
| Dataset | normalized_counts_per_kilobase_for_GSEA.class.cls #AHRR-overexpressed_versus_Control |
| Phenotype | class.cls#AHRR-overexpressed_versus_Control |
| Upregulated in class | AHRR-overexpressed |
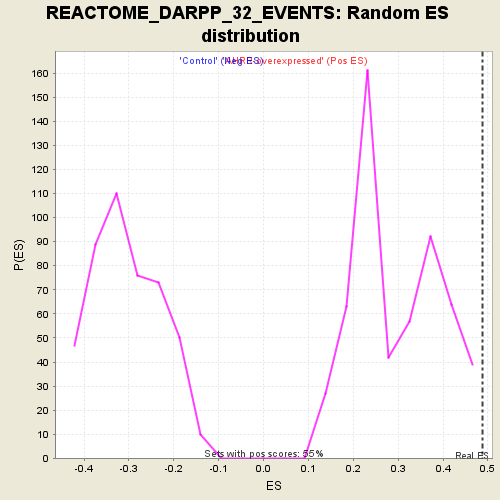
| GeneSet | REACTOME_DARPP_32_EVENTS |
| Enrichment Score (ES) | 0.48800188 |
| Normalized Enrichment Score (NES) | 1.6345438 |
| Nominal p-value | 0.0 |
| FDR q-value | 0.26869246 |
| FWER p-Value | 0.702 |
| PROBE | DESCRIPTION (from dataset) | GENE SYMBOL | GENE_TITLE | RANK IN GENE LIST | RANK METRIC SCORE | RUNNING ES | CORE ENRICHMENT | |
|---|---|---|---|---|---|---|---|---|
| 1 | PRKACA | na | 639 | 1.170 | 0.1557 | Yes | ||
| 2 | PRKAR2B | na | 822 | 1.035 | 0.3150 | Yes | ||
| 3 | PDE4B | na | 2355 | 0.489 | 0.3091 | Yes | ||
| 4 | CALM1 | na | 2418 | 0.478 | 0.3838 | Yes | ||
| 5 | PDE4D | na | 2907 | 0.399 | 0.4217 | Yes | ||
| 6 | PRKAR2A | na | 3692 | 0.302 | 0.4271 | Yes | ||
| 7 | PRKAR1A | na | 4508 | 0.226 | 0.4184 | Yes | ||
| 8 | CALM2 | na | 4797 | 0.203 | 0.4355 | Yes | ||
| 9 | PPP2R5D | na | 5030 | 0.186 | 0.4529 | Yes | ||
| 10 | PPP1CA | na | 5107 | 0.181 | 0.4782 | Yes | ||
| 11 | PPP2R1A | na | 5405 | 0.161 | 0.4880 | Yes | ||
| 12 | CDK5 | na | 6199 | 0.110 | 0.4615 | No | ||
| 13 | PPP3CA | na | 6350 | 0.101 | 0.4696 | No | ||
| 14 | PPP2CB | na | 7109 | 0.058 | 0.4366 | No | ||
| 15 | PPP2R1B | na | 7381 | 0.045 | 0.4288 | No | ||
| 16 | PPP2CA | na | 7712 | 0.028 | 0.4148 | No | ||
| 17 | PRKACB | na | 7911 | 0.017 | 0.4064 | No | ||
| 18 | PDE4C | na | 8362 | -0.005 | 0.3821 | No | ||
| 19 | PRKAR1B | na | 8758 | -0.025 | 0.3639 | No | ||
| 20 | PPP3R1 | na | 8858 | -0.029 | 0.3631 | No | ||
| 21 | PPP3CB | na | 9610 | -0.064 | 0.3315 | No | ||
| 22 | CALM3 | na | 12159 | -0.201 | 0.2214 | No | ||
| 23 | PPP1R1B | na | 16086 | -0.595 | 0.0985 | No |