Profile of the Running ES Score & Positions of GeneSet Members on the Rank Ordered List
| Dataset | normalized_counts_per_kilobase_for_GSEA.class.cls #AHRR-overexpressed_versus_Control |
| Phenotype | class.cls#AHRR-overexpressed_versus_Control |
| Upregulated in class | Control |
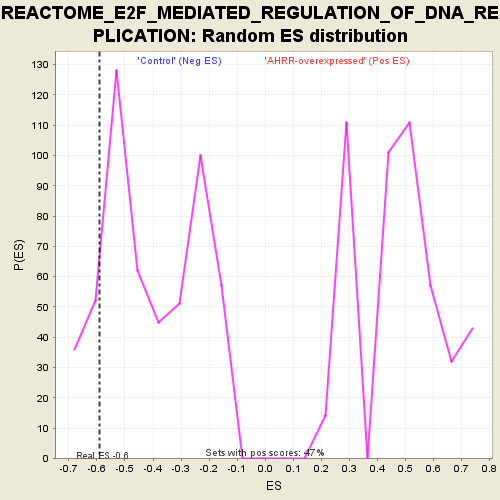
| GeneSet | REACTOME_E2F_MEDIATED_REGULATION_OF_DNA_REPLICATION |
| Enrichment Score (ES) | -0.59055007 |
| Normalized Enrichment Score (NES) | -1.4400012 |
| Nominal p-value | 0.1393597 |
| FDR q-value | 1.0 |
| FWER p-Value | 0.991 |
| PROBE | DESCRIPTION (from dataset) | GENE SYMBOL | GENE_TITLE | RANK IN GENE LIST | RANK METRIC SCORE | RUNNING ES | CORE ENRICHMENT | |
|---|---|---|---|---|---|---|---|---|
| 1 | TK2 | na | 3184 | 0.362 | -0.1435 | No | ||
| 2 | PPP2R1A | na | 5405 | 0.161 | -0.2524 | No | ||
| 3 | CCNB1 | na | 6949 | 0.068 | -0.3325 | No | ||
| 4 | PPP2CB | na | 7109 | 0.058 | -0.3357 | No | ||
| 5 | PPP2R1B | na | 7381 | 0.045 | -0.3466 | No | ||
| 6 | PPP2CA | na | 7712 | 0.028 | -0.3624 | No | ||
| 7 | RB1 | na | 8213 | 0.002 | -0.3903 | No | ||
| 8 | ORC2 | na | 8456 | -0.010 | -0.4029 | No | ||
| 9 | ORC5 | na | 10124 | -0.091 | -0.4877 | No | ||
| 10 | POLA2 | na | 10998 | -0.135 | -0.5235 | No | ||
| 11 | MCM8 | na | 11702 | -0.176 | -0.5459 | No | ||
| 12 | ORC4 | na | 11802 | -0.181 | -0.5338 | No | ||
| 13 | POLA1 | na | 12814 | -0.241 | -0.5671 | Yes | ||
| 14 | ORC3 | na | 12898 | -0.246 | -0.5478 | Yes | ||
| 15 | CDC25A | na | 13205 | -0.268 | -0.5388 | Yes | ||
| 16 | CCNE1 | na | 13504 | -0.293 | -0.5270 | Yes | ||
| 17 | CDC6 | na | 13515 | -0.293 | -0.4990 | Yes | ||
| 18 | TFDP1 | na | 14006 | -0.335 | -0.4939 | Yes | ||
| 19 | PRIM2 | na | 14168 | -0.349 | -0.4689 | Yes | ||
| 20 | ORC6 | na | 14302 | -0.361 | -0.4412 | Yes | ||
| 21 | ORC1 | na | 14468 | -0.377 | -0.4137 | Yes | ||
| 22 | CDK1 | na | 14598 | -0.390 | -0.3829 | Yes | ||
| 23 | FBXO5 | na | 14842 | -0.417 | -0.3560 | Yes | ||
| 24 | PCNA | na | 14965 | -0.429 | -0.3211 | Yes | ||
| 25 | CDC45 | na | 15097 | -0.444 | -0.2852 | Yes | ||
| 26 | RRM2 | na | 15518 | -0.497 | -0.2603 | Yes | ||
| 27 | CCNA1 | na | 15669 | -0.523 | -0.2178 | Yes | ||
| 28 | TYMS | na | 16042 | -0.587 | -0.1816 | Yes | ||
| 29 | PRIM1 | na | 16115 | -0.599 | -0.1273 | Yes | ||
| 30 | DHFR | na | 16410 | -0.663 | -0.0792 | Yes | ||
| 31 | CDT1 | na | 16818 | -0.791 | -0.0250 | Yes | ||
| 32 | E2F1 | na | 16952 | -0.845 | 0.0499 | Yes |