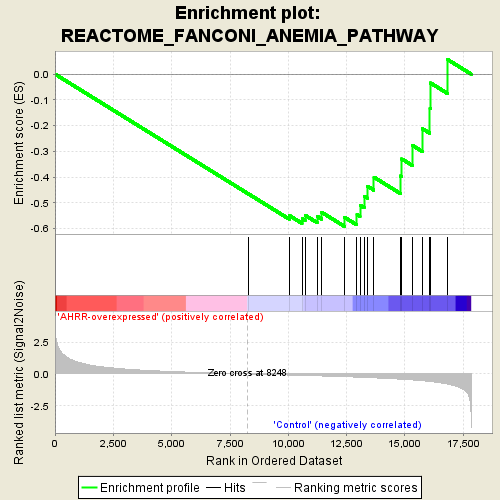
Profile of the Running ES Score & Positions of GeneSet Members on the Rank Ordered List
| Dataset | normalized_counts_per_kilobase_for_GSEA.class.cls #AHRR-overexpressed_versus_Control |
| Phenotype | class.cls#AHRR-overexpressed_versus_Control |
| Upregulated in class | Control |
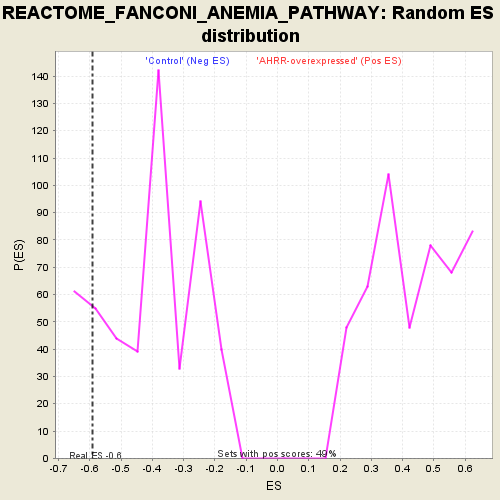
| GeneSet | REACTOME_FANCONI_ANEMIA_PATHWAY |
| Enrichment Score (ES) | -0.59078556 |
| Normalized Enrichment Score (NES) | -1.467216 |
| Nominal p-value | 0.14173229 |
| FDR q-value | 1.0 |
| FWER p-Value | 0.957 |
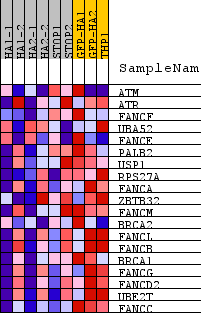
| PROBE | DESCRIPTION (from dataset) | GENE SYMBOL | GENE_TITLE | RANK IN GENE LIST | RANK METRIC SCORE | RUNNING ES | CORE ENRICHMENT | |
|---|---|---|---|---|---|---|---|---|
| 1 | ATM | na | 8283 | -0.001 | -0.4645 | No | ||
| 2 | ATR | na | 10040 | -0.086 | -0.5487 | No | ||
| 3 | FANCF | na | 10589 | -0.114 | -0.5606 | Yes | ||
| 4 | UBA52 | na | 10722 | -0.121 | -0.5480 | Yes | ||
| 5 | FANCE | na | 11239 | -0.149 | -0.5523 | Yes | ||
| 6 | PALB2 | na | 11430 | -0.160 | -0.5364 | Yes | ||
| 7 | USP1 | na | 12400 | -0.214 | -0.5553 | Yes | ||
| 8 | RPS27A | na | 12944 | -0.249 | -0.5445 | Yes | ||
| 9 | FANCA | na | 13076 | -0.258 | -0.5092 | Yes | ||
| 10 | ZBTB32 | na | 13253 | -0.272 | -0.4741 | Yes | ||
| 11 | FANCM | na | 13384 | -0.283 | -0.4346 | Yes | ||
| 12 | BRCA2 | na | 13673 | -0.306 | -0.4001 | Yes | ||
| 13 | FANCL | na | 14805 | -0.412 | -0.3954 | Yes | ||
| 14 | FANCB | na | 14867 | -0.419 | -0.3294 | Yes | ||
| 15 | BRCA1 | na | 15329 | -0.472 | -0.2770 | Yes | ||
| 16 | FANCG | na | 15754 | -0.536 | -0.2121 | Yes | ||
| 17 | FANCD2 | na | 16074 | -0.593 | -0.1318 | Yes | ||
| 18 | UBE2T | na | 16097 | -0.597 | -0.0342 | Yes | ||
| 19 | FANCC | na | 16836 | -0.797 | 0.0564 | Yes |