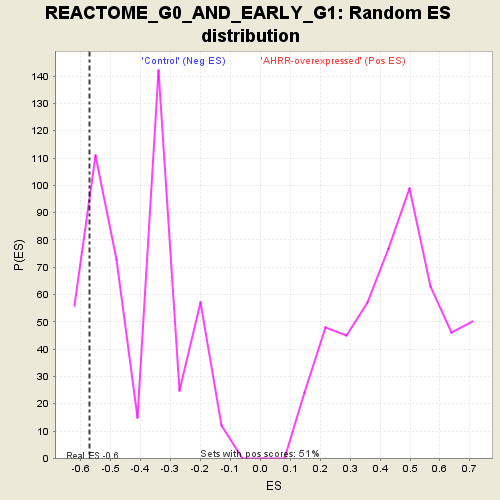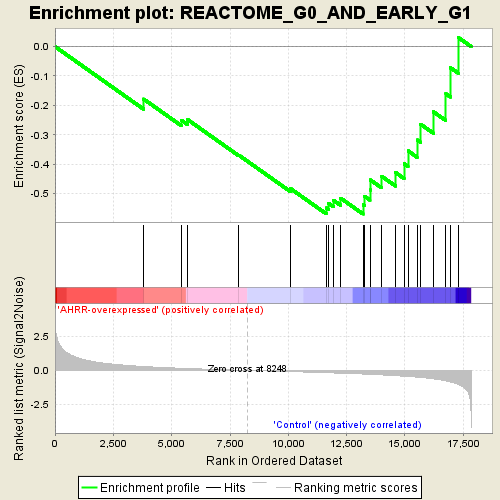
Profile of the Running ES Score & Positions of GeneSet Members on the Rank Ordered List
| Dataset | normalized_counts_per_kilobase_for_GSEA.class.cls #AHRR-overexpressed_versus_Control |
| Phenotype | class.cls#AHRR-overexpressed_versus_Control |
| Upregulated in class | Control |
| GeneSet | REACTOME_G0_AND_EARLY_G1 |
| Enrichment Score (ES) | -0.5696288 |
| Normalized Enrichment Score (NES) | -1.3555832 |
| Nominal p-value | 0.11405295 |
| FDR q-value | 1.0 |
| FWER p-Value | 1.0 |
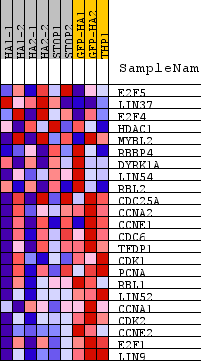
| PROBE | DESCRIPTION (from dataset) | GENE SYMBOL | GENE_TITLE | RANK IN GENE LIST | RANK METRIC SCORE | RUNNING ES | CORE ENRICHMENT | |
|---|---|---|---|---|---|---|---|---|
| 1 | E2F5 | na | 3792 | 0.292 | -0.1782 | No | ||
| 2 | LIN37 | na | 5409 | 0.161 | -0.2499 | No | ||
| 3 | E2F4 | na | 5689 | 0.142 | -0.2487 | No | ||
| 4 | HDAC1 | na | 7874 | 0.019 | -0.3691 | No | ||
| 5 | MYBL2 | na | 10098 | -0.089 | -0.4833 | No | ||
| 6 | RBBP4 | na | 11629 | -0.172 | -0.5489 | Yes | ||
| 7 | DYRK1A | na | 11719 | -0.177 | -0.5329 | Yes | ||
| 8 | LIN54 | na | 11930 | -0.188 | -0.5225 | Yes | ||
| 9 | RBL2 | na | 12239 | -0.206 | -0.5155 | Yes | ||
| 10 | CDC25A | na | 13205 | -0.268 | -0.5379 | Yes | ||
| 11 | CCNA2 | na | 13271 | -0.273 | -0.5092 | Yes | ||
| 12 | CCNE1 | na | 13504 | -0.293 | -0.4876 | Yes | ||
| 13 | CDC6 | na | 13515 | -0.293 | -0.4535 | Yes | ||
| 14 | TFDP1 | na | 14006 | -0.335 | -0.4414 | Yes | ||
| 15 | CDK1 | na | 14598 | -0.390 | -0.4285 | Yes | ||
| 16 | PCNA | na | 14965 | -0.429 | -0.3983 | Yes | ||
| 17 | RBL1 | na | 15135 | -0.448 | -0.3547 | Yes | ||
| 18 | LIN52 | na | 15523 | -0.498 | -0.3176 | Yes | ||
| 19 | CCNA1 | na | 15669 | -0.523 | -0.2639 | Yes | ||
| 20 | CDK2 | na | 16222 | -0.618 | -0.2218 | Yes | ||
| 21 | CCNE2 | na | 16756 | -0.769 | -0.1608 | Yes | ||
| 22 | E2F1 | na | 16952 | -0.845 | -0.0717 | Yes | ||
| 23 | LIN9 | na | 17287 | -1.028 | 0.0311 | Yes |