Profile of the Running ES Score & Positions of GeneSet Members on the Rank Ordered List
| Dataset | normalized_counts_per_kilobase_for_GSEA.class.cls #AHRR-overexpressed_versus_Control |
| Phenotype | class.cls#AHRR-overexpressed_versus_Control |
| Upregulated in class | Control |
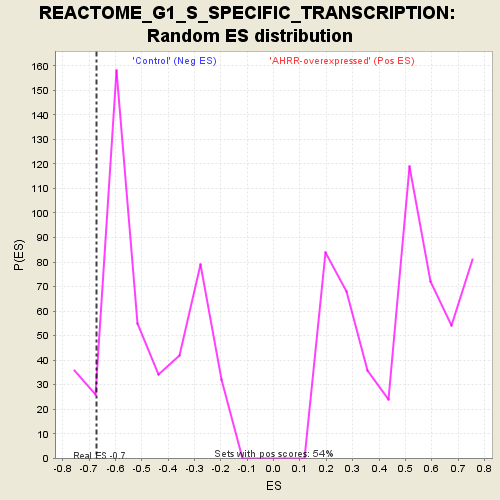
| GeneSet | REACTOME_G1_S_SPECIFIC_TRANSCRIPTION |
| Enrichment Score (ES) | -0.672123 |
| Normalized Enrichment Score (NES) | -1.3672721 |
| Nominal p-value | 0.077922076 |
| FDR q-value | 1.0 |
| FWER p-Value | 1.0 |
| PROBE | DESCRIPTION (from dataset) | GENE SYMBOL | GENE_TITLE | RANK IN GENE LIST | RANK METRIC SCORE | RUNNING ES | CORE ENRICHMENT | |
|---|---|---|---|---|---|---|---|---|
| 1 | TK2 | na | 3184 | 0.362 | -0.1319 | No | ||
| 2 | POLA1 | na | 12814 | -0.241 | -0.6410 | Yes | ||
| 3 | CDC25A | na | 13205 | -0.268 | -0.6283 | Yes | ||
| 4 | CCNE1 | na | 13504 | -0.293 | -0.6073 | Yes | ||
| 5 | CDC6 | na | 13515 | -0.293 | -0.5700 | Yes | ||
| 6 | TFDP1 | na | 14006 | -0.335 | -0.5543 | Yes | ||
| 7 | ORC1 | na | 14468 | -0.377 | -0.5315 | Yes | ||
| 8 | CDK1 | na | 14598 | -0.390 | -0.4885 | Yes | ||
| 9 | FBXO5 | na | 14842 | -0.417 | -0.4484 | Yes | ||
| 10 | PCNA | na | 14965 | -0.429 | -0.3999 | Yes | ||
| 11 | CDC45 | na | 15097 | -0.444 | -0.3501 | Yes | ||
| 12 | RRM2 | na | 15518 | -0.497 | -0.3095 | Yes | ||
| 13 | CCNA1 | na | 15669 | -0.523 | -0.2505 | Yes | ||
| 14 | TYMS | na | 16042 | -0.587 | -0.1958 | Yes | ||
| 15 | DHFR | na | 16410 | -0.663 | -0.1309 | Yes | ||
| 16 | CDT1 | na | 16818 | -0.791 | -0.0517 | Yes | ||
| 17 | E2F1 | na | 16952 | -0.845 | 0.0499 | Yes |