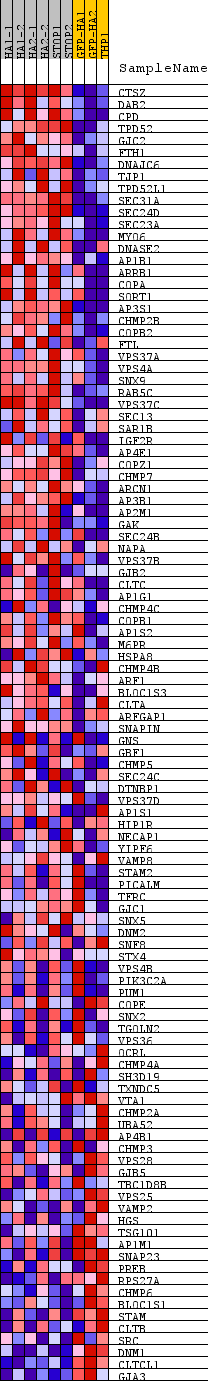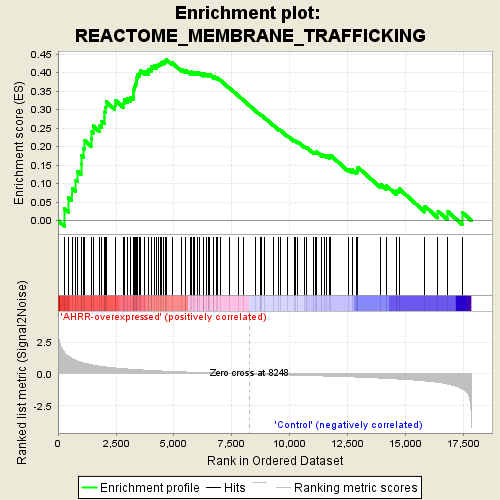
Profile of the Running ES Score & Positions of GeneSet Members on the Rank Ordered List
| Dataset | normalized_counts_per_kilobase_for_GSEA.class.cls #AHRR-overexpressed_versus_Control |
| Phenotype | class.cls#AHRR-overexpressed_versus_Control |
| Upregulated in class | AHRR-overexpressed |
| GeneSet | REACTOME_MEMBRANE_TRAFFICKING |
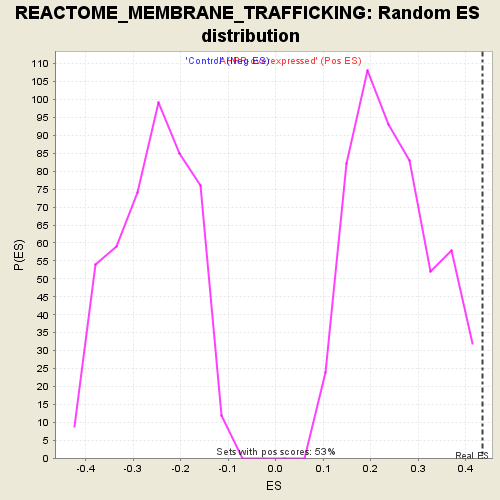
| Enrichment Score (ES) | 0.43513438 |
| Normalized Enrichment Score (NES) | 1.7452687 |
| Nominal p-value | 0.0 |
| FDR q-value | 0.32199946 |
| FWER p-Value | 0.352 |
| PROBE | DESCRIPTION (from dataset) | GENE SYMBOL | GENE_TITLE | RANK IN GENE LIST | RANK METRIC SCORE | RUNNING ES | CORE ENRICHMENT | |
|---|---|---|---|---|---|---|---|---|
| 1 | CTSZ | na | 277 | 1.675 | 0.0319 | Yes | ||
| 2 | DAB2 | na | 445 | 1.383 | 0.0617 | Yes | ||
| 3 | CPD | na | 601 | 1.221 | 0.0876 | Yes | ||
| 4 | TPD52 | na | 770 | 1.077 | 0.1086 | Yes | ||
| 5 | GJC2 | na | 840 | 1.018 | 0.1336 | Yes | ||
| 6 | FTH1 | na | 991 | 0.915 | 0.1511 | Yes | ||
| 7 | DNAJC6 | na | 1009 | 0.907 | 0.1759 | Yes | ||
| 8 | TJP1 | na | 1103 | 0.863 | 0.1951 | Yes | ||
| 9 | TPD52L1 | na | 1142 | 0.841 | 0.2168 | Yes | ||
| 10 | SEC31A | na | 1427 | 0.723 | 0.2213 | Yes | ||
| 11 | SEC24D | na | 1460 | 0.712 | 0.2396 | Yes | ||
| 12 | SEC23A | na | 1517 | 0.691 | 0.2561 | Yes | ||
| 13 | MYO6 | na | 1806 | 0.606 | 0.2570 | Yes | ||
| 14 | DNASE2 | na | 1892 | 0.583 | 0.2687 | Yes | ||
| 15 | AP1B1 | na | 2011 | 0.556 | 0.2778 | Yes | ||
| 16 | ARRB1 | na | 2014 | 0.556 | 0.2935 | Yes | ||
| 17 | COPA | na | 2058 | 0.547 | 0.3066 | Yes | ||
| 18 | SORT1 | na | 2070 | 0.545 | 0.3214 | Yes | ||
| 19 | AP3S1 | na | 2457 | 0.469 | 0.3129 | Yes | ||
| 20 | CHMP2B | na | 2493 | 0.462 | 0.3241 | Yes | ||
| 21 | COPB2 | na | 2842 | 0.408 | 0.3160 | Yes | ||
| 22 | FTL | na | 2853 | 0.406 | 0.3270 | Yes | ||
| 23 | VPS37A | na | 2992 | 0.385 | 0.3301 | Yes | ||
| 24 | VPS4A | na | 3121 | 0.371 | 0.3334 | Yes | ||
| 25 | SNX9 | na | 3241 | 0.354 | 0.3368 | Yes | ||
| 26 | RAB5C | na | 3258 | 0.352 | 0.3458 | Yes | ||
| 27 | VPS37C | na | 3274 | 0.350 | 0.3549 | Yes | ||
| 28 | SEC13 | na | 3293 | 0.347 | 0.3637 | Yes | ||
| 29 | SAR1B | na | 3333 | 0.341 | 0.3712 | Yes | ||
| 30 | IGF2R | na | 3391 | 0.335 | 0.3775 | Yes | ||
| 31 | AP4E1 | na | 3402 | 0.334 | 0.3864 | Yes | ||
| 32 | COPZ1 | na | 3437 | 0.330 | 0.3938 | Yes | ||
| 33 | CHMP7 | na | 3520 | 0.322 | 0.3983 | Yes | ||
| 34 | ARCN1 | na | 3545 | 0.319 | 0.4060 | Yes | ||
| 35 | AP3B1 | na | 3737 | 0.299 | 0.4037 | Yes | ||
| 36 | AP2M1 | na | 3896 | 0.281 | 0.4027 | Yes | ||
| 37 | GAK | na | 3913 | 0.279 | 0.4097 | Yes | ||
| 38 | SEC24B | na | 4025 | 0.268 | 0.4111 | Yes | ||
| 39 | NAPA | na | 4046 | 0.266 | 0.4175 | Yes | ||
| 40 | VPS37B | na | 4157 | 0.254 | 0.4185 | Yes | ||
| 41 | GJB2 | na | 4270 | 0.244 | 0.4191 | Yes | ||
| 42 | CLTC | na | 4328 | 0.240 | 0.4227 | Yes | ||
| 43 | AP1G1 | na | 4409 | 0.234 | 0.4248 | Yes | ||
| 44 | CHMP4C | na | 4463 | 0.229 | 0.4283 | Yes | ||
| 45 | COPB1 | na | 4559 | 0.223 | 0.4293 | Yes | ||
| 46 | AP1S2 | na | 4619 | 0.217 | 0.4321 | Yes | ||
| 47 | M6PR | na | 4673 | 0.212 | 0.4351 | Yes | ||
| 48 | HSPA8 | na | 4922 | 0.194 | 0.4266 | No | ||
| 49 | CHMP4B | na | 5341 | 0.165 | 0.4078 | No | ||
| 50 | ARF1 | na | 5492 | 0.156 | 0.4037 | No | ||
| 51 | BLOC1S3 | na | 5513 | 0.154 | 0.4070 | No | ||
| 52 | CLTA | na | 5711 | 0.140 | 0.3998 | No | ||
| 53 | ARFGAP1 | na | 5743 | 0.138 | 0.4020 | No | ||
| 54 | SNAPIN | na | 5849 | 0.132 | 0.3998 | No | ||
| 55 | GNS | na | 5903 | 0.128 | 0.4004 | No | ||
| 56 | GBF1 | na | 6014 | 0.121 | 0.3977 | No | ||
| 57 | CHMP5 | na | 6030 | 0.120 | 0.4002 | No | ||
| 58 | SEC24C | na | 6112 | 0.116 | 0.3989 | No | ||
| 59 | DTNBP1 | na | 6262 | 0.106 | 0.3936 | No | ||
| 60 | VPS37D | na | 6264 | 0.106 | 0.3965 | No | ||
| 61 | AP1S1 | na | 6277 | 0.105 | 0.3988 | No | ||
| 62 | HIP1R | na | 6403 | 0.098 | 0.3945 | No | ||
| 63 | NECAP1 | na | 6474 | 0.094 | 0.3933 | No | ||
| 64 | YIPF6 | na | 6496 | 0.093 | 0.3947 | No | ||
| 65 | VAMP8 | na | 6546 | 0.090 | 0.3945 | No | ||
| 66 | STAM2 | na | 6718 | 0.081 | 0.3871 | No | ||
| 67 | PICALM | na | 6719 | 0.081 | 0.3894 | No | ||
| 68 | TFRC | na | 6841 | 0.074 | 0.3847 | No | ||
| 69 | GJC1 | na | 6863 | 0.073 | 0.3856 | No | ||
| 70 | SNX5 | na | 6996 | 0.065 | 0.3800 | No | ||
| 71 | DNM2 | na | 7395 | 0.044 | 0.3588 | No | ||
| 72 | SNF8 | na | 7800 | 0.023 | 0.3367 | No | ||
| 73 | STX4 | na | 8013 | 0.011 | 0.3250 | No | ||
| 74 | VPS4B | na | 8534 | -0.014 | 0.2961 | No | ||
| 75 | PIK3C2A | na | 8732 | -0.023 | 0.2856 | No | ||
| 76 | PUM1 | na | 8745 | -0.024 | 0.2856 | No | ||
| 77 | COPE | na | 8785 | -0.025 | 0.2841 | No | ||
| 78 | SNX2 | na | 8905 | -0.031 | 0.2783 | No | ||
| 79 | TGOLN2 | na | 9298 | -0.051 | 0.2577 | No | ||
| 80 | VPS36 | na | 9536 | -0.061 | 0.2460 | No | ||
| 81 | OCRL | na | 9600 | -0.064 | 0.2443 | No | ||
| 82 | CHMP4A | na | 9919 | -0.080 | 0.2286 | No | ||
| 83 | SH3D19 | na | 10185 | -0.094 | 0.2163 | No | ||
| 84 | TXNDC5 | na | 10255 | -0.097 | 0.2152 | No | ||
| 85 | VTA1 | na | 10355 | -0.102 | 0.2125 | No | ||
| 86 | CHMP2A | na | 10640 | -0.117 | 0.1998 | No | ||
| 87 | UBA52 | na | 10722 | -0.121 | 0.1986 | No | ||
| 88 | AP4B1 | na | 11035 | -0.137 | 0.1849 | No | ||
| 89 | CHMP3 | na | 11110 | -0.141 | 0.1848 | No | ||
| 90 | VPS28 | na | 11148 | -0.143 | 0.1867 | No | ||
| 91 | GJB5 | na | 11389 | -0.159 | 0.1777 | No | ||
| 92 | TBC1D8B | na | 11485 | -0.164 | 0.1770 | No | ||
| 93 | VPS25 | na | 11596 | -0.170 | 0.1756 | No | ||
| 94 | VAMP2 | na | 11720 | -0.177 | 0.1737 | No | ||
| 95 | HGS | na | 11761 | -0.179 | 0.1765 | No | ||
| 96 | TSG101 | na | 12541 | -0.222 | 0.1389 | No | ||
| 97 | AP1M1 | na | 12696 | -0.233 | 0.1368 | No | ||
| 98 | SNAP23 | na | 12879 | -0.245 | 0.1335 | No | ||
| 99 | PREB | na | 12924 | -0.248 | 0.1380 | No | ||
| 100 | RPS27A | na | 12944 | -0.249 | 0.1440 | No | ||
| 101 | CHMP6 | na | 13939 | -0.328 | 0.0973 | No | ||
| 102 | BLOC1S1 | na | 14169 | -0.349 | 0.0943 | No | ||
| 103 | STAM | na | 14618 | -0.392 | 0.0801 | No | ||
| 104 | CLTB | na | 14720 | -0.404 | 0.0859 | No | ||
| 105 | SRC | na | 15836 | -0.548 | 0.0385 | No | ||
| 106 | DNM1 | na | 16401 | -0.659 | 0.0254 | No | ||
| 107 | CLTCL1 | na | 16828 | -0.794 | 0.0239 | No | ||
| 108 | GJA3 | na | 17442 | -1.169 | 0.0225 | No |