Fig 1: heat_map
Heat Map of the top 50 features for each phenotype in normalized_counts_per_kilobase_for_GSEA
Fig 2: Ranked Gene List Correlation Profile
Ranked list correlations for normalized_counts_per_kilobase_for_GSEA
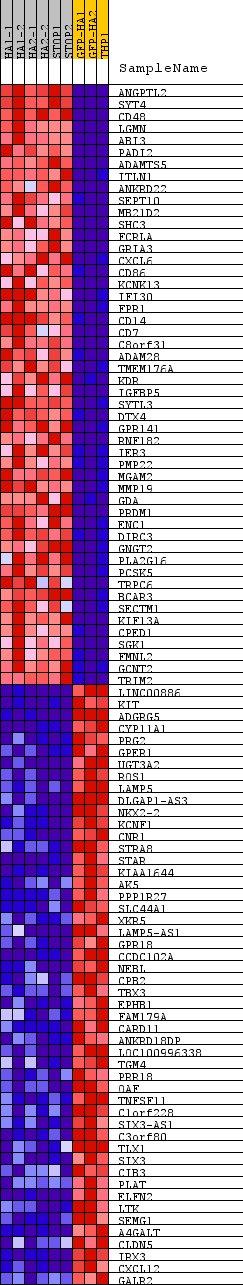 Fig 1: heat_map
  Fig 2: Ranked Gene List Correlation Profile