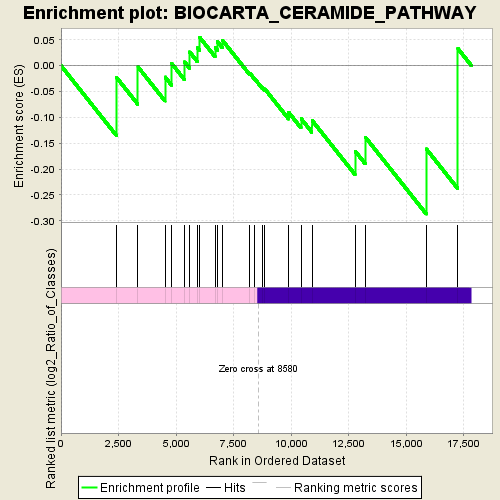
Profile of the Running ES Score & Positions of GeneSet Members on the Rank Ordered List
| Dataset | normalized_counts_per_kilobase_for_GSEA_1.class_1.cls #AHRR-overexpressed_versus_Control |
| Phenotype | class_1.cls#AHRR-overexpressed_versus_Control |
| Upregulated in class | Control |
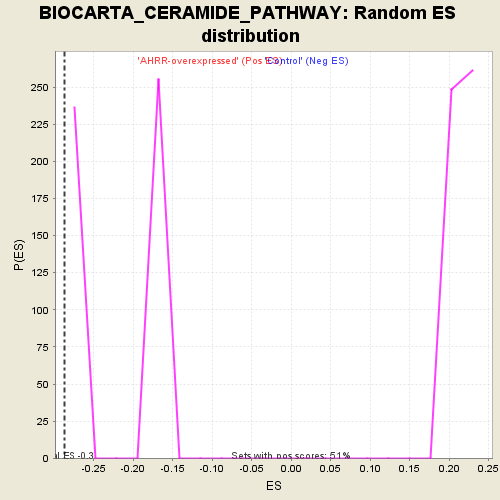
| GeneSet | BIOCARTA_CERAMIDE_PATHWAY |
| Enrichment Score (ES) | -0.28684533 |
| Normalized Enrichment Score (NES) | -1.3137832 |
| Nominal p-value | 0.0 |
| FDR q-value | 1.0 |
| FWER p-Value | 1.0 |
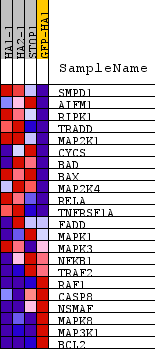
| PROBE | DESCRIPTION (from dataset) | GENE SYMBOL | GENE_TITLE | RANK IN GENE LIST | RANK METRIC SCORE | RUNNING ES | CORE ENRICHMENT | |
|---|---|---|---|---|---|---|---|---|
| 1 | SMPD1 | na | 2416 | 0.531 | -0.0230 | No | ||
| 2 | AIFM1 | na | 3343 | 0.342 | -0.0024 | No | ||
| 3 | RIPK1 | na | 4519 | 0.219 | -0.0218 | No | ||
| 4 | TRADD | na | 4805 | 0.199 | 0.0044 | No | ||
| 5 | MAP2K1 | na | 5369 | 0.163 | 0.0073 | No | ||
| 6 | CYCS | na | 5589 | 0.149 | 0.0266 | No | ||
| 7 | BAD | na | 5928 | 0.127 | 0.0347 | No | ||
| 8 | BAX | na | 6030 | 0.121 | 0.0546 | No | ||
| 9 | MAP2K4 | na | 6697 | 0.085 | 0.0353 | No | ||
| 10 | RELA | na | 6799 | 0.080 | 0.0466 | No | ||
| 11 | TNFRSF1A | na | 7010 | 0.069 | 0.0494 | No | ||
| 12 | FADD | na | 8212 | 0.015 | -0.0148 | No | ||
| 13 | MAPK1 | na | 8426 | 0.004 | -0.0259 | No | ||
| 14 | MAPK3 | na | 8739 | -0.009 | -0.0415 | No | ||
| 15 | NFKB1 | na | 8854 | -0.014 | -0.0448 | No | ||
| 16 | TRAF2 | na | 9894 | -0.061 | -0.0903 | No | ||
| 17 | RAF1 | na | 10433 | -0.086 | -0.1023 | No | ||
| 18 | CASP8 | na | 10908 | -0.110 | -0.1056 | No | ||
| 19 | NSMAF | na | 12782 | -0.215 | -0.1650 | Yes | ||
| 20 | MAPK8 | na | 13225 | -0.244 | -0.1381 | Yes | ||
| 21 | MAP3K1 | na | 15877 | -0.593 | -0.1610 | Yes | ||
| 22 | BCL2 | na | 17251 | -1.278 | 0.0331 | Yes |