Profile of the Running ES Score & Positions of GeneSet Members on the Rank Ordered List
| Dataset | normalized_counts_per_kilobase_for_GSEA_1.class_1.cls #AHRR-overexpressed_versus_Control |
| Phenotype | class_1.cls#AHRR-overexpressed_versus_Control |
| Upregulated in class | Control |
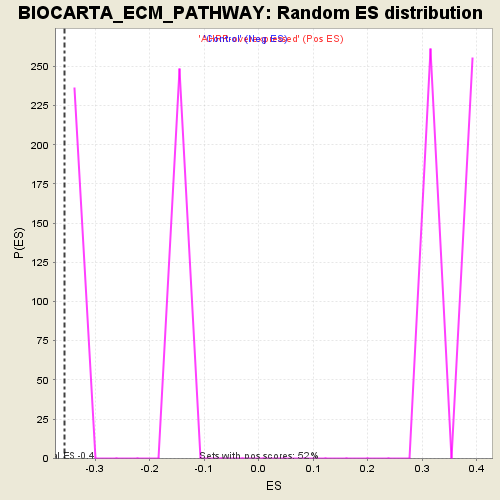
| GeneSet | BIOCARTA_ECM_PATHWAY |
| Enrichment Score (ES) | -0.35636118 |
| Normalized Enrichment Score (NES) | -1.4324228 |
| Nominal p-value | 0.0 |
| FDR q-value | 1.0 |
| FWER p-Value | 1.0 |
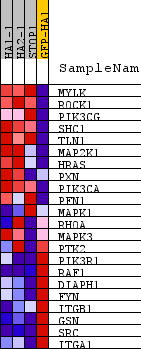
| PROBE | DESCRIPTION (from dataset) | GENE SYMBOL | GENE_TITLE | RANK IN GENE LIST | RANK METRIC SCORE | RUNNING ES | CORE ENRICHMENT | |
|---|---|---|---|---|---|---|---|---|
| 1 | MYLK | na | 1244 | 1.041 | 0.1076 | No | ||
| 2 | ROCK1 | na | 3418 | 0.332 | 0.0422 | No | ||
| 3 | PIK3CG | na | 4134 | 0.252 | 0.0451 | No | ||
| 4 | SHC1 | na | 4623 | 0.211 | 0.0536 | No | ||
| 5 | TLN1 | na | 5107 | 0.178 | 0.0569 | No | ||
| 6 | MAP2K1 | na | 5369 | 0.163 | 0.0700 | No | ||
| 7 | HRAS | na | 6149 | 0.115 | 0.0458 | No | ||
| 8 | PXN | na | 6592 | 0.090 | 0.0363 | No | ||
| 9 | PIK3CA | na | 7226 | 0.059 | 0.0109 | No | ||
| 10 | PFN1 | na | 7993 | 0.024 | -0.0280 | No | ||
| 11 | MAPK1 | na | 8426 | 0.004 | -0.0515 | No | ||
| 12 | RHOA | na | 8702 | -0.007 | -0.0657 | No | ||
| 13 | MAPK3 | na | 8739 | -0.009 | -0.0662 | No | ||
| 14 | PTK2 | na | 9119 | -0.025 | -0.0833 | No | ||
| 15 | PIK3R1 | na | 10367 | -0.083 | -0.1392 | No | ||
| 16 | RAF1 | na | 10433 | -0.086 | -0.1282 | No | ||
| 17 | DIAPH1 | na | 10574 | -0.093 | -0.1202 | No | ||
| 18 | FYN | na | 12456 | -0.194 | -0.1927 | No | ||
| 19 | ITGB1 | na | 13778 | -0.286 | -0.2181 | No | ||
| 20 | GSN | na | 16242 | -0.699 | -0.2373 | Yes | ||
| 21 | SRC | na | 16527 | -0.788 | -0.1189 | Yes | ||
| 22 | ITGA1 | na | 17102 | -1.130 | 0.0415 | Yes |