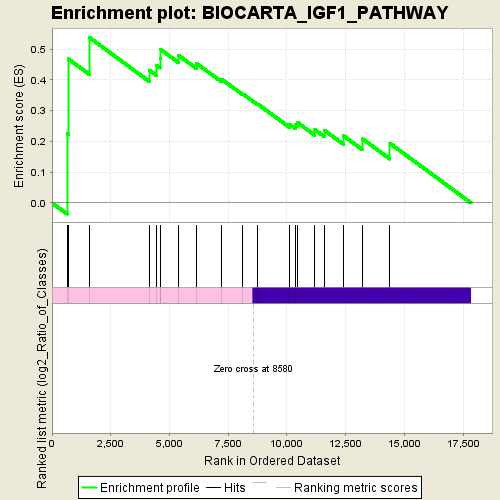
Profile of the Running ES Score & Positions of GeneSet Members on the Rank Ordered List
| Dataset | normalized_counts_per_kilobase_for_GSEA_1.class_1.cls #AHRR-overexpressed_versus_Control |
| Phenotype | class_1.cls#AHRR-overexpressed_versus_Control |
| Upregulated in class | AHRR-overexpressed |
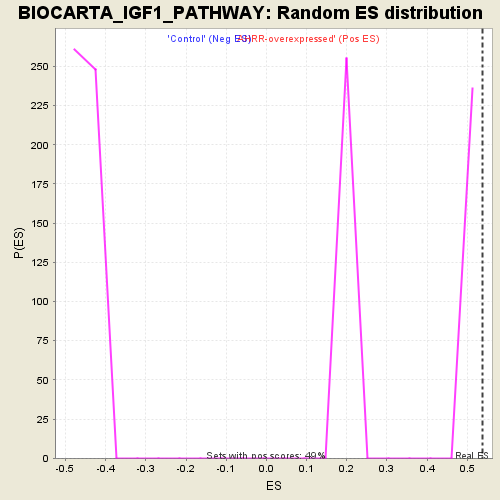
| GeneSet | BIOCARTA_IGF1_PATHWAY |
| Enrichment Score (ES) | 0.5378613 |
| Normalized Enrichment Score (NES) | 1.4617062 |
| Nominal p-value | 0.0 |
| FDR q-value | 0.6148933 |
| FWER p-Value | 1.0 |
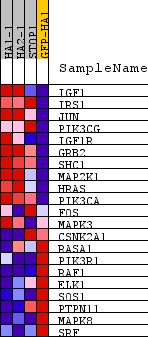
| PROBE | DESCRIPTION (from dataset) | GENE SYMBOL | GENE_TITLE | RANK IN GENE LIST | RANK METRIC SCORE | RUNNING ES | CORE ENRICHMENT | |
|---|---|---|---|---|---|---|---|---|
| 1 | IGF1 | na | 639 | 1.802 | 0.2260 | Yes | ||
| 2 | IRS1 | na | 693 | 1.686 | 0.4681 | Yes | ||
| 3 | JUN | na | 1588 | 0.825 | 0.5379 | Yes | ||
| 4 | PIK3CG | na | 4134 | 0.252 | 0.4317 | No | ||
| 5 | IGF1R | na | 4432 | 0.227 | 0.4480 | No | ||
| 6 | GRB2 | na | 4599 | 0.212 | 0.4695 | No | ||
| 7 | SHC1 | na | 4623 | 0.211 | 0.4988 | No | ||
| 8 | MAP2K1 | na | 5369 | 0.163 | 0.4806 | No | ||
| 9 | HRAS | na | 6149 | 0.115 | 0.4536 | No | ||
| 10 | PIK3CA | na | 7226 | 0.059 | 0.4019 | No | ||
| 11 | FOS | na | 8125 | 0.019 | 0.3542 | No | ||
| 12 | MAPK3 | na | 8739 | -0.009 | 0.3211 | No | ||
| 13 | CSNK2A1 | na | 8756 | -0.010 | 0.3216 | No | ||
| 14 | RASA1 | na | 10101 | -0.071 | 0.2565 | No | ||
| 15 | PIK3R1 | na | 10367 | -0.083 | 0.2537 | No | ||
| 16 | RAF1 | na | 10433 | -0.086 | 0.2625 | No | ||
| 17 | ELK1 | na | 11193 | -0.124 | 0.2379 | No | ||
| 18 | SOS1 | na | 11594 | -0.144 | 0.2363 | No | ||
| 19 | PTPN11 | na | 12404 | -0.191 | 0.2187 | No | ||
| 20 | MAPK8 | na | 13225 | -0.244 | 0.2081 | No | ||
| 21 | SRF | na | 14389 | -0.350 | 0.1937 | No |