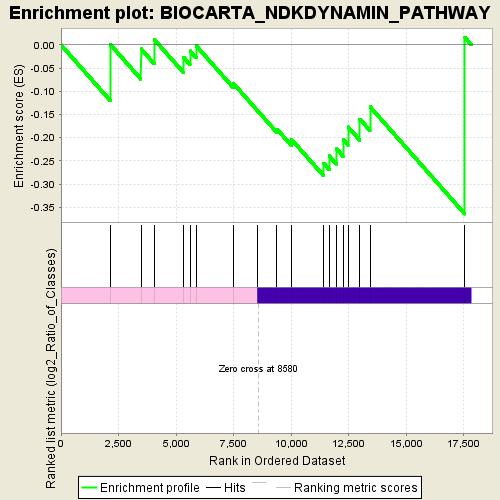
Profile of the Running ES Score & Positions of GeneSet Members on the Rank Ordered List
| Dataset | normalized_counts_per_kilobase_for_GSEA_1.class_1.cls #AHRR-overexpressed_versus_Control |
| Phenotype | class_1.cls#AHRR-overexpressed_versus_Control |
| Upregulated in class | Control |
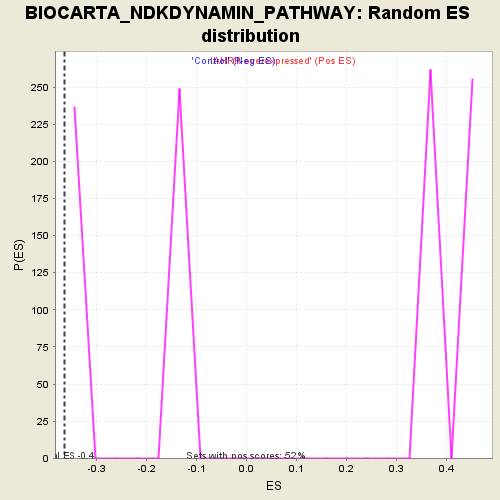
| GeneSet | BIOCARTA_NDKDYNAMIN_PATHWAY |
| Enrichment Score (ES) | -0.36447933 |
| Normalized Enrichment Score (NES) | -1.4471511 |
| Nominal p-value | 0.0 |
| FDR q-value | 1.0 |
| FWER p-Value | 1.0 |
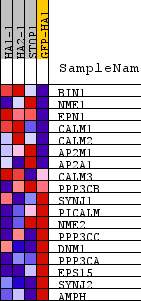
| PROBE | DESCRIPTION (from dataset) | GENE SYMBOL | GENE_TITLE | RANK IN GENE LIST | RANK METRIC SCORE | RUNNING ES | CORE ENRICHMENT | |
|---|---|---|---|---|---|---|---|---|
| 1 | BIN1 | na | 2138 | 0.604 | 0.0011 | No | ||
| 2 | NME1 | na | 3474 | 0.326 | -0.0084 | No | ||
| 3 | EPN1 | na | 4051 | 0.261 | 0.0117 | No | ||
| 4 | CALM1 | na | 5322 | 0.165 | -0.0265 | No | ||
| 5 | CALM2 | na | 5607 | 0.147 | -0.0129 | No | ||
| 6 | AP2M1 | na | 5877 | 0.130 | -0.0019 | No | ||
| 7 | AP2A1 | na | 7497 | 0.047 | -0.0833 | No | ||
| 8 | CALM3 | na | 8555 | -0.001 | -0.1424 | No | ||
| 9 | PPP3CB | na | 9381 | -0.037 | -0.1814 | No | ||
| 10 | SYNJ1 | na | 10008 | -0.066 | -0.2032 | No | ||
| 11 | PICALM | na | 11421 | -0.134 | -0.2555 | Yes | ||
| 12 | NME2 | na | 11652 | -0.147 | -0.2391 | Yes | ||
| 13 | PPP3CC | na | 11970 | -0.164 | -0.2240 | Yes | ||
| 14 | DNM1 | na | 12260 | -0.181 | -0.2039 | Yes | ||
| 15 | PPP3CA | na | 12475 | -0.195 | -0.1768 | Yes | ||
| 16 | EPS15 | na | 12987 | -0.228 | -0.1597 | Yes | ||
| 17 | SYNJ2 | na | 13432 | -0.256 | -0.1333 | Yes | ||
| 18 | AMPH | na | 17554 | -1.899 | 0.0161 | Yes |