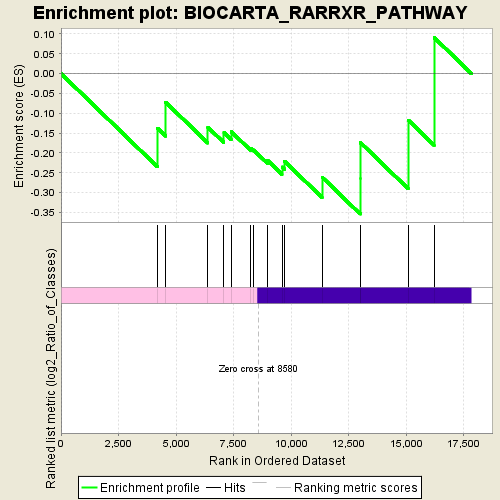
Profile of the Running ES Score & Positions of GeneSet Members on the Rank Ordered List
| Dataset | normalized_counts_per_kilobase_for_GSEA_1.class_1.cls #AHRR-overexpressed_versus_Control |
| Phenotype | class_1.cls#AHRR-overexpressed_versus_Control |
| Upregulated in class | Control |
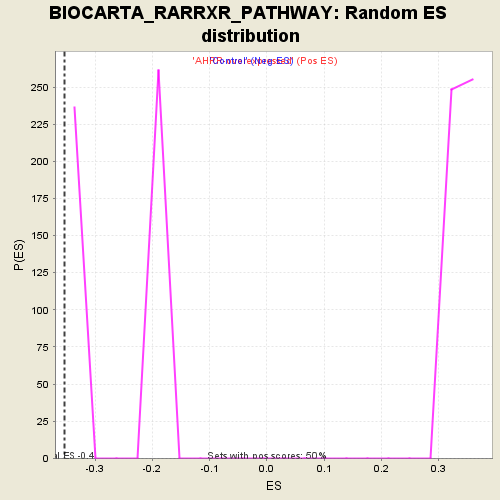
| GeneSet | BIOCARTA_RARRXR_PATHWAY |
| Enrichment Score (ES) | -0.35382593 |
| Normalized Enrichment Score (NES) | -1.3334626 |
| Nominal p-value | 0.0 |
| FDR q-value | 1.0 |
| FWER p-Value | 1.0 |
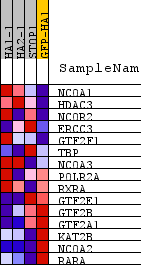
| PROBE | DESCRIPTION (from dataset) | GENE SYMBOL | GENE_TITLE | RANK IN GENE LIST | RANK METRIC SCORE | RUNNING ES | CORE ENRICHMENT | |
|---|---|---|---|---|---|---|---|---|
| 1 | NCOA1 | na | 4185 | 0.248 | -0.1373 | No | ||
| 2 | HDAC3 | na | 4546 | 0.217 | -0.0720 | No | ||
| 3 | NCOR2 | na | 6382 | 0.101 | -0.1350 | No | ||
| 4 | ERCC3 | na | 7082 | 0.065 | -0.1486 | No | ||
| 5 | GTF2F1 | na | 7394 | 0.051 | -0.1459 | No | ||
| 6 | TBP | na | 8238 | 0.014 | -0.1878 | No | ||
| 7 | NCOA3 | na | 8369 | 0.007 | -0.1924 | No | ||
| 8 | POLR2A | na | 8979 | -0.019 | -0.2190 | No | ||
| 9 | RXRA | na | 9605 | -0.048 | -0.2353 | No | ||
| 10 | GTF2E1 | na | 9708 | -0.052 | -0.2205 | No | ||
| 11 | GTF2B | na | 11347 | -0.131 | -0.2609 | No | ||
| 12 | GTF2A1 | na | 13005 | -0.229 | -0.2636 | Yes | ||
| 13 | KAT2B | na | 13007 | -0.229 | -0.1734 | Yes | ||
| 14 | NCOA2 | na | 15089 | -0.440 | -0.1171 | Yes | ||
| 15 | RARA | na | 16216 | -0.690 | 0.0912 | Yes |