Profile of the Running ES Score & Positions of GeneSet Members on the Rank Ordered List
| Dataset | normalized_counts_per_kilobase_for_GSEA_1.class_1.cls #AHRR-overexpressed_versus_Control |
| Phenotype | class_1.cls#AHRR-overexpressed_versus_Control |
| Upregulated in class | Control |
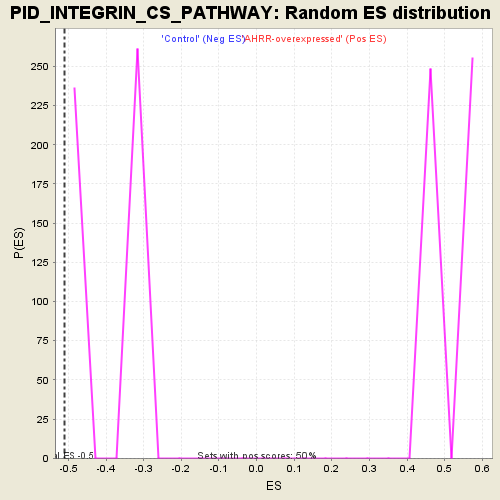
| GeneSet | PID_INTEGRIN_CS_PATHWAY |
| Enrichment Score (ES) | -0.51073086 |
| Normalized Enrichment Score (NES) | -1.291794 |
| Nominal p-value | 0.0 |
| FDR q-value | 1.0 |
| FWER p-Value | 1.0 |
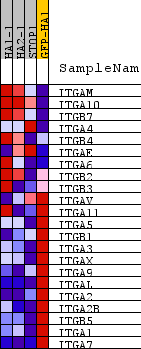
| PROBE | DESCRIPTION (from dataset) | GENE SYMBOL | GENE_TITLE | RANK IN GENE LIST | RANK METRIC SCORE | RUNNING ES | CORE ENRICHMENT | |
|---|---|---|---|---|---|---|---|---|
| 1 | ITGAM | na | 1166 | 1.100 | 0.0259 | No | ||
| 2 | ITGA10 | na | 1209 | 1.064 | 0.1118 | No | ||
| 3 | ITGB7 | na | 1844 | 0.706 | 0.1349 | No | ||
| 4 | ITGA4 | na | 4793 | 0.199 | -0.0140 | No | ||
| 5 | ITGB4 | na | 6441 | 0.098 | -0.0983 | No | ||
| 6 | ITGAE | na | 6540 | 0.092 | -0.0961 | No | ||
| 7 | ITGA6 | na | 6637 | 0.087 | -0.0943 | No | ||
| 8 | ITGB2 | na | 8752 | -0.009 | -0.2121 | No | ||
| 9 | ITGB3 | na | 10162 | -0.073 | -0.2851 | No | ||
| 10 | ITGAV | na | 11561 | -0.142 | -0.3518 | No | ||
| 11 | ITGA11 | na | 11882 | -0.160 | -0.3565 | No | ||
| 12 | ITGA5 | na | 13460 | -0.258 | -0.4236 | No | ||
| 13 | ITGB1 | na | 13778 | -0.286 | -0.4176 | No | ||
| 14 | ITGA3 | na | 15438 | -0.499 | -0.4693 | Yes | ||
| 15 | ITGAX | na | 15705 | -0.559 | -0.4378 | Yes | ||
| 16 | ITGA9 | na | 16209 | -0.685 | -0.4092 | Yes | ||
| 17 | ITGAL | na | 16365 | -0.737 | -0.3568 | Yes | ||
| 18 | ITGA2 | na | 16775 | -0.911 | -0.3041 | Yes | ||
| 19 | ITGA2B | na | 16854 | -0.957 | -0.2290 | Yes | ||
| 20 | ITGB5 | na | 17010 | -1.061 | -0.1497 | Yes | ||
| 21 | ITGA1 | na | 17102 | -1.130 | -0.0610 | Yes | ||
| 22 | ITGA7 | na | 17199 | -1.233 | 0.0360 | Yes |