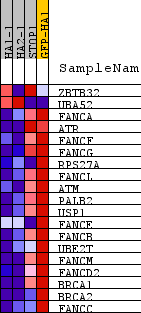
Profile of the Running ES Score & Positions of GeneSet Members on the Rank Ordered List
| Dataset | normalized_counts_per_kilobase_for_GSEA_1.class_1.cls #AHRR-overexpressed_versus_Control |
| Phenotype | class_1.cls#AHRR-overexpressed_versus_Control |
| Upregulated in class | Control |
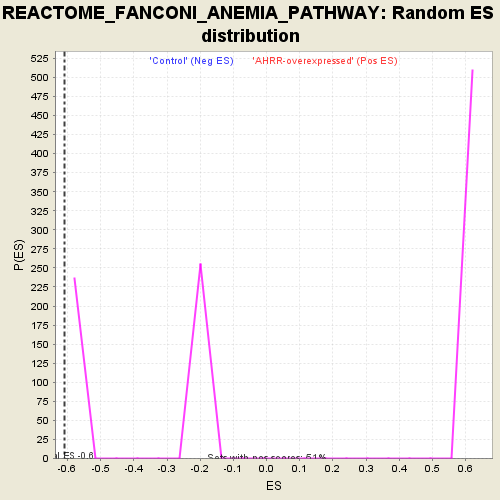
| GeneSet | REACTOME_FANCONI_ANEMIA_PATHWAY |
| Enrichment Score (ES) | -0.60892427 |
| Normalized Enrichment Score (NES) | -1.5197994 |
| Nominal p-value | 0.0 |
| FDR q-value | 1.0 |
| FWER p-Value | 1.0 |
| PROBE | DESCRIPTION (from dataset) | GENE SYMBOL | GENE_TITLE | RANK IN GENE LIST | RANK METRIC SCORE | RUNNING ES | CORE ENRICHMENT | |
|---|---|---|---|---|---|---|---|---|
| 1 | ZBTB32 | na | 6471 | 0.096 | -0.3462 | No | ||
| 2 | UBA52 | na | 6492 | 0.095 | -0.3306 | No | ||
| 3 | FANCA | na | 10926 | -0.111 | -0.5598 | No | ||
| 4 | ATR | na | 11512 | -0.139 | -0.5682 | No | ||
| 5 | FANCF | na | 12239 | -0.180 | -0.5773 | Yes | ||
| 6 | FANCG | na | 12258 | -0.181 | -0.5464 | Yes | ||
| 7 | RPS27A | na | 12562 | -0.200 | -0.5282 | Yes | ||
| 8 | FANCL | na | 13132 | -0.237 | -0.5184 | Yes | ||
| 9 | ATM | na | 13314 | -0.250 | -0.4846 | Yes | ||
| 10 | PALB2 | na | 13347 | -0.251 | -0.4423 | Yes | ||
| 11 | USP1 | na | 14012 | -0.310 | -0.4249 | Yes | ||
| 12 | FANCE | na | 14107 | -0.318 | -0.3742 | Yes | ||
| 13 | FANCB | na | 14160 | -0.323 | -0.3202 | Yes | ||
| 14 | UBE2T | na | 14292 | -0.339 | -0.2680 | Yes | ||
| 15 | FANCM | na | 14880 | -0.410 | -0.2289 | Yes | ||
| 16 | FANCD2 | na | 15232 | -0.462 | -0.1673 | Yes | ||
| 17 | BRCA1 | na | 15562 | -0.524 | -0.0936 | Yes | ||
| 18 | BRCA2 | na | 15872 | -0.592 | -0.0068 | Yes | ||
| 19 | FANCC | na | 16159 | -0.666 | 0.0944 | Yes |