Profile of the Running ES Score & Positions of GeneSet Members on the Rank Ordered List
| Dataset | normalized_counts_per_kilobase_for_GSEA_1.class_1.cls #AHRR-overexpressed_versus_Control |
| Phenotype | class_1.cls#AHRR-overexpressed_versus_Control |
| Upregulated in class | Control |
| GeneSet | REACTOME_G0_AND_EARLY_G1 |
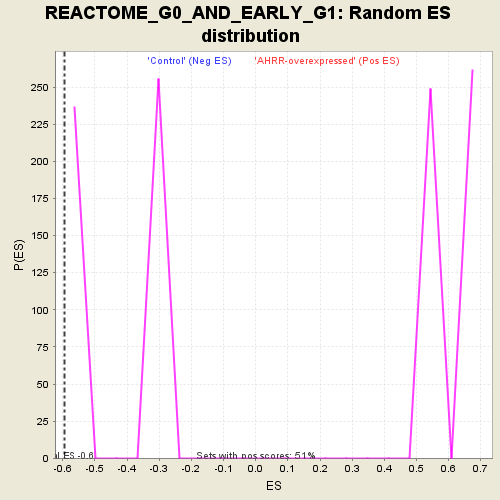
| Enrichment Score (ES) | -0.5944902 |
| Normalized Enrichment Score (NES) | -1.3281566 |
| Nominal p-value | 0.0 |
| FDR q-value | 1.0 |
| FWER p-Value | 1.0 |
| PROBE | DESCRIPTION (from dataset) | GENE SYMBOL | GENE_TITLE | RANK IN GENE LIST | RANK METRIC SCORE | RUNNING ES | CORE ENRICHMENT | |
|---|---|---|---|---|---|---|---|---|
| 1 | E2F5 | na | 3224 | 0.361 | -0.1301 | No | ||
| 2 | LIN37 | na | 6199 | 0.112 | -0.2812 | No | ||
| 3 | E2F4 | na | 6279 | 0.108 | -0.2704 | No | ||
| 4 | HDAC1 | na | 9080 | -0.023 | -0.4243 | No | ||
| 5 | MYBL2 | na | 9767 | -0.055 | -0.4551 | No | ||
| 6 | CCNA1 | na | 12097 | -0.171 | -0.5616 | No | ||
| 7 | DYRK1A | na | 12684 | -0.209 | -0.5650 | Yes | ||
| 8 | CCNE1 | na | 12765 | -0.214 | -0.5393 | Yes | ||
| 9 | CCNA2 | na | 12975 | -0.227 | -0.5190 | Yes | ||
| 10 | CDK1 | na | 13206 | -0.242 | -0.4978 | Yes | ||
| 11 | LIN52 | na | 13456 | -0.258 | -0.4754 | Yes | ||
| 12 | RBBP4 | na | 13462 | -0.258 | -0.4393 | Yes | ||
| 13 | CDC6 | na | 13706 | -0.279 | -0.4136 | Yes | ||
| 14 | RBL2 | na | 14067 | -0.315 | -0.3895 | Yes | ||
| 15 | TFDP1 | na | 14090 | -0.317 | -0.3461 | Yes | ||
| 16 | LIN54 | na | 14165 | -0.325 | -0.3044 | Yes | ||
| 17 | CDC25A | na | 14419 | -0.353 | -0.2689 | Yes | ||
| 18 | PCNA | na | 14727 | -0.389 | -0.2313 | Yes | ||
| 19 | CDK2 | na | 14803 | -0.399 | -0.1793 | Yes | ||
| 20 | RBL1 | na | 15412 | -0.495 | -0.1436 | Yes | ||
| 21 | LIN9 | na | 15815 | -0.585 | -0.0838 | Yes | ||
| 22 | E2F1 | na | 16003 | -0.623 | -0.0064 | Yes | ||
| 23 | CCNE2 | na | 16495 | -0.777 | 0.0755 | Yes |