Profile of the Running ES Score & Positions of GeneSet Members on the Rank Ordered List
| Dataset | normalized_counts_per_kilobase_for_GSEA_1.class_1.cls #AHRR-overexpressed_versus_Control |
| Phenotype | class_1.cls#AHRR-overexpressed_versus_Control |
| Upregulated in class | Control |
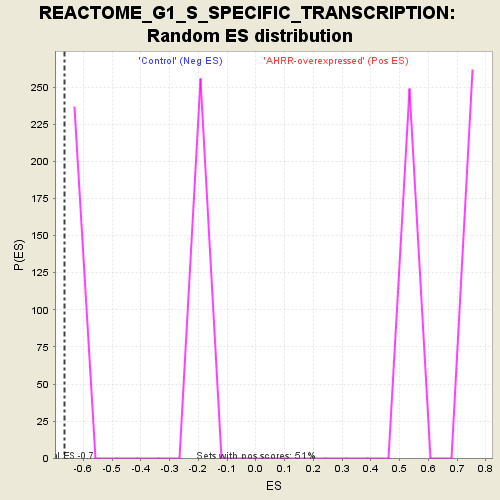
| GeneSet | REACTOME_G1_S_SPECIFIC_TRANSCRIPTION |
| Enrichment Score (ES) | -0.6654781 |
| Normalized Enrichment Score (NES) | -1.6079953 |
| Nominal p-value | 0.0 |
| FDR q-value | 0.85352653 |
| FWER p-Value | 0.248 |
| PROBE | DESCRIPTION (from dataset) | GENE SYMBOL | GENE_TITLE | RANK IN GENE LIST | RANK METRIC SCORE | RUNNING ES | CORE ENRICHMENT | |
|---|---|---|---|---|---|---|---|---|
| 1 | TK2 | na | 5755 | 0.138 | -0.3003 | No | ||
| 2 | CCNA1 | na | 12097 | -0.171 | -0.6281 | No | ||
| 3 | CCNE1 | na | 12765 | -0.214 | -0.6305 | Yes | ||
| 4 | CDK1 | na | 13206 | -0.242 | -0.6156 | Yes | ||
| 5 | CDC45 | na | 13497 | -0.260 | -0.5893 | Yes | ||
| 6 | CDC6 | na | 13706 | -0.279 | -0.5554 | Yes | ||
| 7 | ORC1 | na | 13974 | -0.306 | -0.5204 | Yes | ||
| 8 | TFDP1 | na | 14090 | -0.317 | -0.4752 | Yes | ||
| 9 | POLA1 | na | 14177 | -0.327 | -0.4266 | Yes | ||
| 10 | CDC25A | na | 14419 | -0.353 | -0.3825 | Yes | ||
| 11 | TYMS | na | 14437 | -0.354 | -0.3256 | Yes | ||
| 12 | PCNA | na | 14727 | -0.389 | -0.2784 | Yes | ||
| 13 | FBXO5 | na | 14838 | -0.403 | -0.2187 | Yes | ||
| 14 | CDT1 | na | 15622 | -0.541 | -0.1743 | Yes | ||
| 15 | DHFR | na | 15692 | -0.556 | -0.0874 | Yes | ||
| 16 | E2F1 | na | 16003 | -0.623 | -0.0030 | Yes | ||
| 17 | RRM2 | na | 16102 | -0.649 | 0.0976 | Yes |