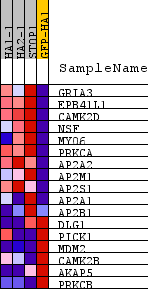
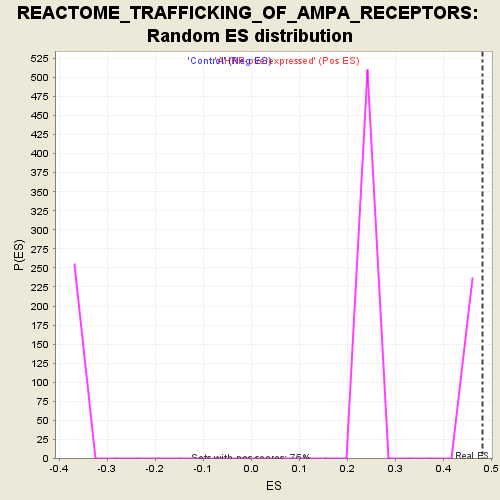
Profile of the Running ES Score & Positions of GeneSet Members on the Rank Ordered List
| Dataset | normalized_counts_per_kilobase_for_GSEA_1.class_1.cls #AHRR-overexpressed_versus_Control |
| Phenotype | class_1.cls#AHRR-overexpressed_versus_Control |
| Upregulated in class | AHRR-overexpressed |
| GeneSet | REACTOME_TRAFFICKING_OF_AMPA_RECEPTORS |
| Enrichment Score (ES) | 0.48170602 |
| Normalized Enrichment Score (NES) | 1.504195 |
| Nominal p-value | 0.0 |
| FDR q-value | 0.6247712 |
| FWER p-Value | 1.0 |
| PROBE | DESCRIPTION (from dataset) | GENE SYMBOL | GENE_TITLE | RANK IN GENE LIST | RANK METRIC SCORE | RUNNING ES | CORE ENRICHMENT | |
|---|---|---|---|---|---|---|---|---|
| 1 | GRIA3 | na | 491 | 2.361 | 0.2339 | Yes | ||
| 2 | EPB41L1 | na | 669 | 1.744 | 0.4170 | Yes | ||
| 3 | CAMK2D | na | 1381 | 0.944 | 0.4817 | Yes | ||
| 4 | NSF | na | 3878 | 0.279 | 0.3726 | No | ||
| 5 | MYO6 | na | 4127 | 0.253 | 0.3867 | No | ||
| 6 | PRKCA | na | 4615 | 0.211 | 0.3827 | No | ||
| 7 | AP2A2 | na | 5739 | 0.139 | 0.3351 | No | ||
| 8 | AP2M1 | na | 5877 | 0.130 | 0.3418 | No | ||
| 9 | AP2S1 | na | 5996 | 0.123 | 0.3488 | No | ||
| 10 | AP2A1 | na | 7497 | 0.047 | 0.2699 | No | ||
| 11 | AP2B1 | na | 7786 | 0.034 | 0.2575 | No | ||
| 12 | DLG1 | na | 11477 | -0.137 | 0.0657 | No | ||
| 13 | PICK1 | na | 11836 | -0.157 | 0.0630 | No | ||
| 14 | MDM2 | na | 15504 | -0.514 | -0.0858 | No | ||
| 15 | CAMK2B | na | 15700 | -0.557 | -0.0351 | No | ||
| 16 | AKAP5 | na | 15943 | -0.608 | 0.0187 | No | ||
| 17 | PRKCB | na | 16539 | -0.792 | 0.0730 | No |