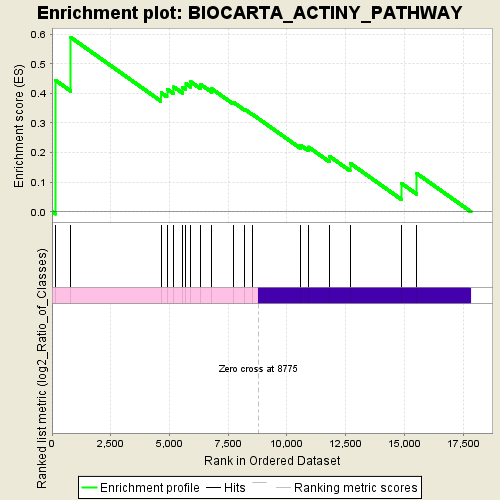
Profile of the Running ES Score & Positions of GeneSet Members on the Rank Ordered List
| Dataset | normalized_counts_per_kilobase_for_GSEA_2.class_2.cls #AHRR-overexpressed_versus_Control |
| Phenotype | class_2.cls#AHRR-overexpressed_versus_Control |
| Upregulated in class | AHRR-overexpressed |
| GeneSet | BIOCARTA_ACTINY_PATHWAY |
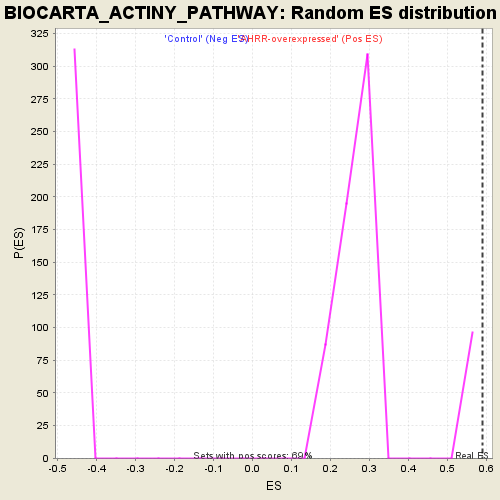
| Enrichment Score (ES) | 0.5887782 |
| Normalized Enrichment Score (NES) | 1.8640789 |
| Nominal p-value | 0.0 |
| FDR q-value | 0.20937772 |
| FWER p-Value | 0.197 |
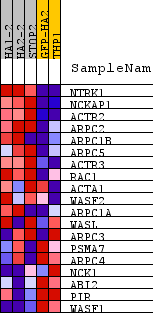
| PROBE | DESCRIPTION (from dataset) | GENE SYMBOL | GENE_TITLE | RANK IN GENE LIST | RANK METRIC SCORE | RUNNING ES | CORE ENRICHMENT | |
|---|---|---|---|---|---|---|---|---|
| 1 | NTRK1 | na | 131 | 2.985 | 0.4450 | Yes | ||
| 2 | NCKAP1 | na | 801 | 1.196 | 0.5888 | Yes | ||
| 3 | ACTR2 | na | 4638 | 0.191 | 0.4024 | No | ||
| 4 | ARPC2 | na | 4895 | 0.173 | 0.4143 | No | ||
| 5 | ARPC1B | na | 5184 | 0.155 | 0.4216 | No | ||
| 6 | ARPC5 | na | 5560 | 0.136 | 0.4212 | No | ||
| 7 | ACTR3 | na | 5702 | 0.128 | 0.4328 | No | ||
| 8 | RAC1 | na | 5908 | 0.117 | 0.4390 | No | ||
| 9 | ACTA1 | na | 6321 | 0.098 | 0.4307 | No | ||
| 10 | WASF2 | na | 6802 | 0.076 | 0.4153 | No | ||
| 11 | ARPC1A | na | 7709 | 0.040 | 0.3706 | No | ||
| 12 | WASL | na | 8208 | 0.022 | 0.3460 | No | ||
| 13 | ARPC3 | na | 8537 | 0.008 | 0.3288 | No | ||
| 14 | PSMA7 | na | 10589 | -0.071 | 0.2245 | No | ||
| 15 | ARPC4 | na | 10917 | -0.085 | 0.2190 | No | ||
| 16 | NCK1 | na | 11802 | -0.124 | 0.1882 | No | ||
| 17 | ABI2 | na | 12690 | -0.171 | 0.1643 | No | ||
| 18 | PIR | na | 14872 | -0.359 | 0.0964 | No | ||
| 19 | WASF1 | na | 15530 | -0.463 | 0.1297 | No |