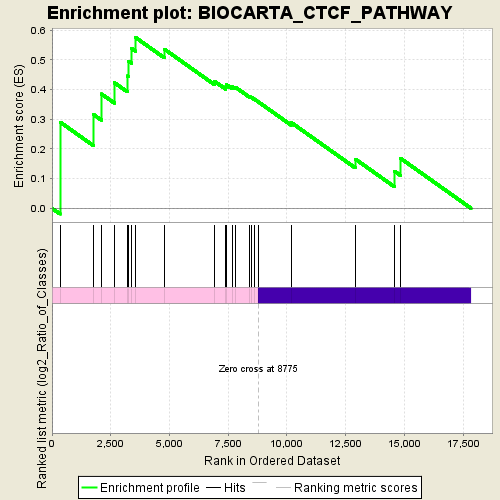
Profile of the Running ES Score & Positions of GeneSet Members on the Rank Ordered List
| Dataset | normalized_counts_per_kilobase_for_GSEA_2.class_2.cls #AHRR-overexpressed_versus_Control |
| Phenotype | class_2.cls#AHRR-overexpressed_versus_Control |
| Upregulated in class | AHRR-overexpressed |
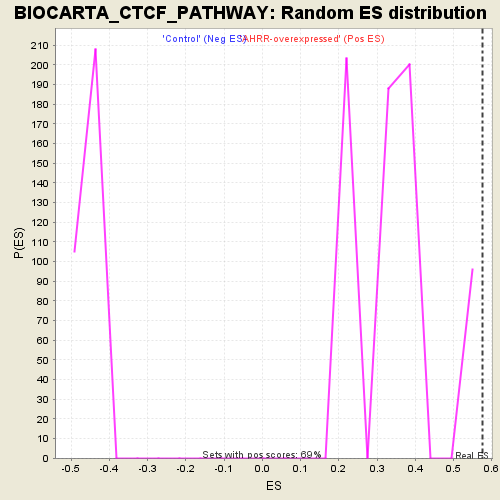
| GeneSet | BIOCARTA_CTCF_PATHWAY |
| Enrichment Score (ES) | 0.5755799 |
| Normalized Enrichment Score (NES) | 1.6657538 |
| Nominal p-value | 0.0 |
| FDR q-value | 0.2635331 |
| FWER p-Value | 0.491 |
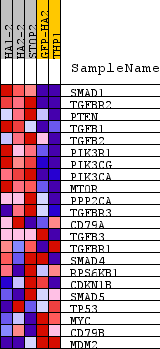
| PROBE | DESCRIPTION (from dataset) | GENE SYMBOL | GENE_TITLE | RANK IN GENE LIST | RANK METRIC SCORE | RUNNING ES | CORE ENRICHMENT | |
|---|---|---|---|---|---|---|---|---|
| 1 | SMAD1 | na | 341 | 1.900 | 0.2906 | Yes | ||
| 2 | TGFBR2 | na | 1765 | 0.645 | 0.3159 | Yes | ||
| 3 | PTEN | na | 2101 | 0.542 | 0.3854 | Yes | ||
| 4 | TGFB1 | na | 2655 | 0.422 | 0.4232 | Yes | ||
| 5 | TGFB2 | na | 3204 | 0.329 | 0.4460 | Yes | ||
| 6 | PIK3R1 | na | 3251 | 0.323 | 0.4960 | Yes | ||
| 7 | PIK3CG | na | 3383 | 0.305 | 0.5385 | Yes | ||
| 8 | PIK3CA | na | 3554 | 0.286 | 0.5756 | Yes | ||
| 9 | MTOR | na | 4781 | 0.181 | 0.5363 | No | ||
| 10 | PPP2CA | na | 6915 | 0.071 | 0.4282 | No | ||
| 11 | TGFBR3 | na | 7402 | 0.052 | 0.4094 | No | ||
| 12 | CD79A | na | 7423 | 0.051 | 0.4167 | No | ||
| 13 | TGFB3 | na | 7674 | 0.041 | 0.4094 | No | ||
| 14 | TGFBR1 | na | 7799 | 0.037 | 0.4085 | No | ||
| 15 | SMAD4 | na | 8409 | 0.014 | 0.3765 | No | ||
| 16 | RPS6KB1 | na | 8481 | 0.011 | 0.3743 | No | ||
| 17 | CDKN1B | na | 8605 | 0.006 | 0.3684 | No | ||
| 18 | SMAD5 | na | 8790 | -0.001 | 0.3582 | No | ||
| 19 | TP53 | na | 10180 | -0.055 | 0.2893 | No | ||
| 20 | MYC | na | 12909 | -0.184 | 0.1662 | No | ||
| 21 | CD79B | na | 14584 | -0.324 | 0.1250 | No | ||
| 22 | MDM2 | na | 14841 | -0.354 | 0.1684 | No |