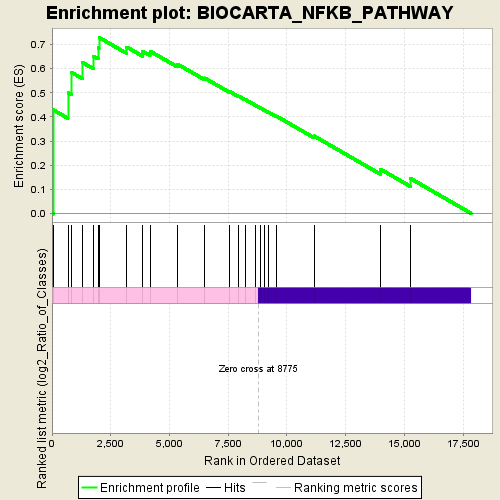
Profile of the Running ES Score & Positions of GeneSet Members on the Rank Ordered List
| Dataset | normalized_counts_per_kilobase_for_GSEA_2.class_2.cls #AHRR-overexpressed_versus_Control |
| Phenotype | class_2.cls#AHRR-overexpressed_versus_Control |
| Upregulated in class | AHRR-overexpressed |
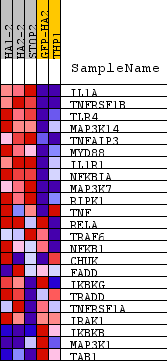
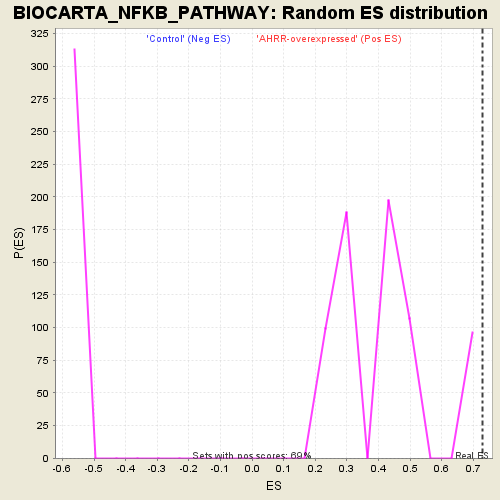
| GeneSet | BIOCARTA_NFKB_PATHWAY |
| Enrichment Score (ES) | 0.72944385 |
| Normalized Enrichment Score (NES) | 1.7289214 |
| Nominal p-value | 0.0 |
| FDR q-value | 0.24091187 |
| FWER p-Value | 0.383 |
| PROBE | DESCRIPTION (from dataset) | GENE SYMBOL | GENE_TITLE | RANK IN GENE LIST | RANK METRIC SCORE | RUNNING ES | CORE ENRICHMENT | |
|---|---|---|---|---|---|---|---|---|
| 1 | IL1A | na | 49 | 5.421 | 0.4292 | Yes | ||
| 2 | TNFRSF1B | na | 679 | 1.324 | 0.4994 | Yes | ||
| 3 | TLR4 | na | 828 | 1.171 | 0.5844 | Yes | ||
| 4 | MAP3K14 | na | 1283 | 0.845 | 0.6263 | Yes | ||
| 5 | TNFAIP3 | na | 1750 | 0.649 | 0.6519 | Yes | ||
| 6 | MYD88 | na | 1959 | 0.582 | 0.6865 | Yes | ||
| 7 | IL1R1 | na | 2000 | 0.567 | 0.7294 | Yes | ||
| 8 | NFKBIA | na | 3178 | 0.332 | 0.6898 | No | ||
| 9 | MAP3K7 | na | 3858 | 0.255 | 0.6721 | No | ||
| 10 | RIPK1 | na | 4171 | 0.227 | 0.6727 | No | ||
| 11 | TNF | na | 5334 | 0.147 | 0.6192 | No | ||
| 12 | RELA | na | 6492 | 0.090 | 0.5614 | No | ||
| 13 | TRAF6 | na | 7542 | 0.047 | 0.5062 | No | ||
| 14 | NFKB1 | na | 7942 | 0.032 | 0.4864 | No | ||
| 15 | CHUK | na | 8229 | 0.021 | 0.4720 | No | ||
| 16 | FADD | na | 8656 | 0.004 | 0.4484 | No | ||
| 17 | IKBKG | na | 8880 | -0.005 | 0.4363 | No | ||
| 18 | TRADD | na | 9032 | -0.010 | 0.4286 | No | ||
| 19 | TNFRSF1A | na | 9206 | -0.016 | 0.4202 | No | ||
| 20 | IRAK1 | na | 9570 | -0.031 | 0.4024 | No | ||
| 21 | IKBKB | na | 11156 | -0.095 | 0.3209 | No | ||
| 22 | MAP3K1 | na | 13983 | -0.261 | 0.1832 | No | ||
| 23 | TAB1 | na | 15270 | -0.418 | 0.1443 | No |