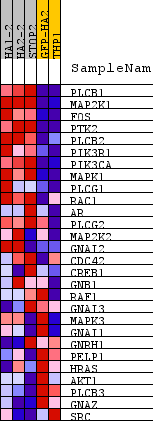
Profile of the Running ES Score & Positions of GeneSet Members on the Rank Ordered List
| Dataset | normalized_counts_per_kilobase_for_GSEA_2.class_2.cls #AHRR-overexpressed_versus_Control |
| Phenotype | class_2.cls#AHRR-overexpressed_versus_Control |
| Upregulated in class | AHRR-overexpressed |
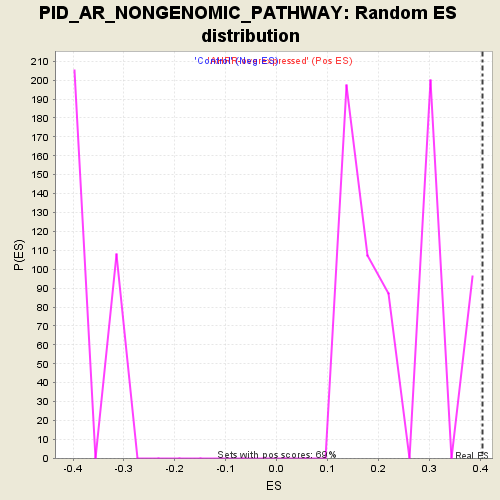
| GeneSet | PID_AR_NONGENOMIC_PATHWAY |
| Enrichment Score (ES) | 0.40376794 |
| Normalized Enrichment Score (NES) | 1.6520058 |
| Nominal p-value | 0.0 |
| FDR q-value | 0.19173293 |
| FWER p-Value | 0.491 |
| PROBE | DESCRIPTION (from dataset) | GENE SYMBOL | GENE_TITLE | RANK IN GENE LIST | RANK METRIC SCORE | RUNNING ES | CORE ENRICHMENT | |
|---|---|---|---|---|---|---|---|---|
| 1 | PLCB1 | na | 883 | 1.124 | 0.1194 | Yes | ||
| 2 | MAP2K1 | na | 1559 | 0.713 | 0.1888 | Yes | ||
| 3 | FOS | na | 1755 | 0.647 | 0.2752 | Yes | ||
| 4 | PTK2 | na | 2087 | 0.545 | 0.3385 | Yes | ||
| 5 | PLCB2 | na | 2928 | 0.372 | 0.3472 | Yes | ||
| 6 | PIK3R1 | na | 3251 | 0.323 | 0.3777 | Yes | ||
| 7 | PIK3CA | na | 3554 | 0.286 | 0.4038 | Yes | ||
| 8 | MAPK1 | na | 4266 | 0.219 | 0.3968 | No | ||
| 9 | PLCG1 | na | 5287 | 0.149 | 0.3620 | No | ||
| 10 | RAC1 | na | 5908 | 0.117 | 0.3448 | No | ||
| 11 | AR | na | 6248 | 0.101 | 0.3409 | No | ||
| 12 | PLCG2 | na | 6683 | 0.082 | 0.3289 | No | ||
| 13 | MAP2K2 | na | 6878 | 0.073 | 0.3291 | No | ||
| 14 | GNAI2 | na | 6978 | 0.069 | 0.3339 | No | ||
| 15 | CDC42 | na | 7068 | 0.065 | 0.3387 | No | ||
| 16 | CREB1 | na | 7330 | 0.055 | 0.3324 | No | ||
| 17 | GNB1 | na | 7404 | 0.052 | 0.3361 | No | ||
| 18 | RAF1 | na | 8761 | 0.000 | 0.2600 | No | ||
| 19 | GNAI3 | na | 9467 | -0.027 | 0.2246 | No | ||
| 20 | MAPK3 | na | 9820 | -0.041 | 0.2109 | No | ||
| 21 | GNAI1 | na | 10585 | -0.071 | 0.1786 | No | ||
| 22 | GNRH1 | na | 10699 | -0.076 | 0.1837 | No | ||
| 23 | PELP1 | na | 11119 | -0.093 | 0.1741 | No | ||
| 24 | HRAS | na | 11793 | -0.124 | 0.1550 | No | ||
| 25 | AKT1 | na | 11942 | -0.131 | 0.1663 | No | ||
| 26 | PLCB3 | na | 13929 | -0.256 | 0.0934 | No | ||
| 27 | GNAZ | na | 15230 | -0.412 | 0.0823 | No | ||
| 28 | SRC | na | 15318 | -0.427 | 0.1416 | No |