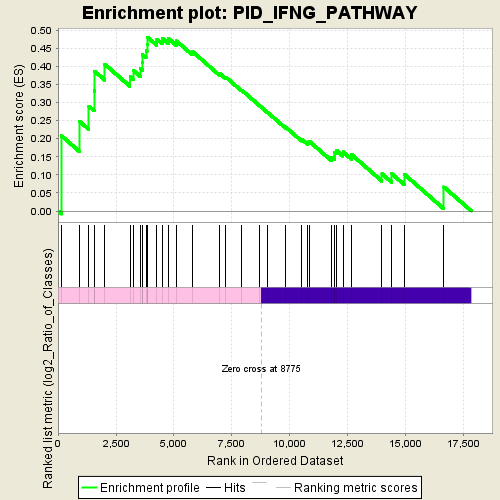
Profile of the Running ES Score & Positions of GeneSet Members on the Rank Ordered List
| Dataset | normalized_counts_per_kilobase_for_GSEA_2.class_2.cls #AHRR-overexpressed_versus_Control |
| Phenotype | class_2.cls#AHRR-overexpressed_versus_Control |
| Upregulated in class | AHRR-overexpressed |
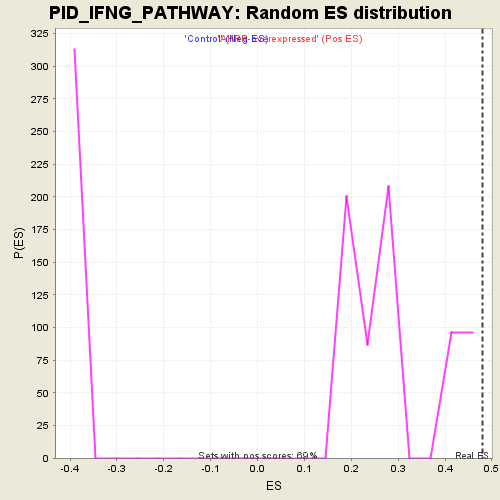
| GeneSet | PID_IFNG_PATHWAY |
| Enrichment Score (ES) | 0.4801158 |
| Normalized Enrichment Score (NES) | 1.6712074 |
| Nominal p-value | 0.0 |
| FDR q-value | 0.3193771 |
| FWER p-Value | 0.491 |
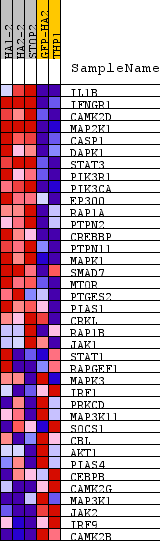
| PROBE | DESCRIPTION (from dataset) | GENE SYMBOL | GENE_TITLE | RANK IN GENE LIST | RANK METRIC SCORE | RUNNING ES | CORE ENRICHMENT | |
|---|---|---|---|---|---|---|---|---|
| 1 | IL1B | na | 148 | 2.766 | 0.2080 | Yes | ||
| 2 | IFNGR1 | na | 935 | 1.071 | 0.2477 | Yes | ||
| 3 | CAMK2D | na | 1331 | 0.821 | 0.2897 | Yes | ||
| 4 | MAP2K1 | na | 1559 | 0.713 | 0.3327 | Yes | ||
| 5 | CASP1 | na | 1583 | 0.705 | 0.3866 | Yes | ||
| 6 | DAPK1 | na | 2020 | 0.560 | 0.4058 | Yes | ||
| 7 | STAT3 | na | 3105 | 0.344 | 0.3718 | Yes | ||
| 8 | PIK3R1 | na | 3251 | 0.323 | 0.3889 | Yes | ||
| 9 | PIK3CA | na | 3554 | 0.286 | 0.3944 | Yes | ||
| 10 | EP300 | na | 3638 | 0.276 | 0.4113 | Yes | ||
| 11 | RAP1A | na | 3645 | 0.275 | 0.4325 | Yes | ||
| 12 | PTPN2 | na | 3799 | 0.260 | 0.4442 | Yes | ||
| 13 | CREBBP | na | 3841 | 0.256 | 0.4620 | Yes | ||
| 14 | PTPN11 | na | 3873 | 0.254 | 0.4801 | Yes | ||
| 15 | MAPK1 | na | 4266 | 0.219 | 0.4752 | No | ||
| 16 | SMAD7 | na | 4495 | 0.202 | 0.4782 | No | ||
| 17 | MTOR | na | 4781 | 0.181 | 0.4764 | No | ||
| 18 | PTGES2 | na | 5108 | 0.160 | 0.4705 | No | ||
| 19 | PIAS1 | na | 5792 | 0.123 | 0.4418 | No | ||
| 20 | CRKL | na | 6983 | 0.069 | 0.3804 | No | ||
| 21 | RAP1B | na | 7239 | 0.059 | 0.3706 | No | ||
| 22 | JAK1 | na | 7924 | 0.032 | 0.3347 | No | ||
| 23 | STAT1 | na | 8712 | 0.002 | 0.2907 | No | ||
| 24 | RAPGEF1 | na | 9036 | -0.010 | 0.2734 | No | ||
| 25 | MAPK3 | na | 9820 | -0.041 | 0.2325 | No | ||
| 26 | IRF1 | na | 10514 | -0.068 | 0.1989 | No | ||
| 27 | PRKCD | na | 10766 | -0.078 | 0.1910 | No | ||
| 28 | MAP3K11 | na | 10842 | -0.082 | 0.1931 | No | ||
| 29 | SOCS1 | na | 11796 | -0.124 | 0.1493 | No | ||
| 30 | CBL | na | 11935 | -0.130 | 0.1517 | No | ||
| 31 | AKT1 | na | 11942 | -0.131 | 0.1616 | No | ||
| 32 | PIAS4 | na | 12009 | -0.134 | 0.1683 | No | ||
| 33 | CEBPB | na | 12301 | -0.149 | 0.1636 | No | ||
| 34 | CAMK2G | na | 12671 | -0.170 | 0.1562 | No | ||
| 35 | MAP3K1 | na | 13983 | -0.261 | 0.1030 | No | ||
| 36 | JAK2 | na | 14410 | -0.305 | 0.1029 | No | ||
| 37 | IRF9 | na | 14943 | -0.370 | 0.1020 | No | ||
| 38 | CAMK2B | na | 16658 | -0.776 | 0.0664 | No |