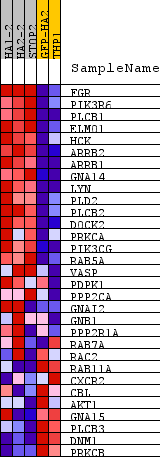
Profile of the Running ES Score & Positions of GeneSet Members on the Rank Ordered List
| Dataset | normalized_counts_per_kilobase_for_GSEA_2.class_2.cls #AHRR-overexpressed_versus_Control |
| Phenotype | class_2.cls#AHRR-overexpressed_versus_Control |
| Upregulated in class | AHRR-overexpressed |
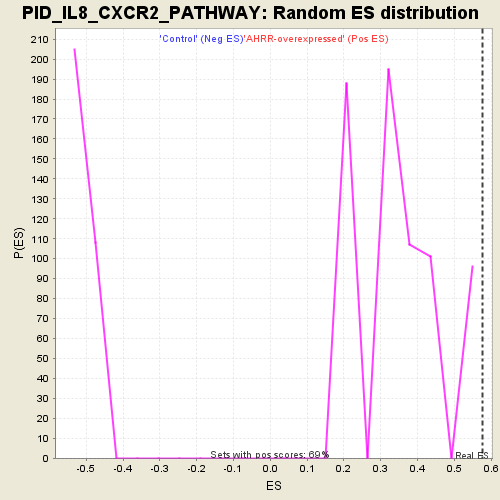
| GeneSet | PID_IL8_CXCR2_PATHWAY |
| Enrichment Score (ES) | 0.5766599 |
| Normalized Enrichment Score (NES) | 1.6160536 |
| Nominal p-value | 0.0 |
| FDR q-value | 0.20467538 |
| FWER p-Value | 0.491 |
| PROBE | DESCRIPTION (from dataset) | GENE SYMBOL | GENE_TITLE | RANK IN GENE LIST | RANK METRIC SCORE | RUNNING ES | CORE ENRICHMENT | |
|---|---|---|---|---|---|---|---|---|
| 1 | FGR | na | 601 | 1.413 | 0.0862 | Yes | ||
| 2 | PIK3R6 | na | 622 | 1.380 | 0.2022 | Yes | ||
| 3 | PLCB1 | na | 883 | 1.124 | 0.2830 | Yes | ||
| 4 | ELMO1 | na | 1542 | 0.720 | 0.3072 | Yes | ||
| 5 | HCK | na | 1901 | 0.603 | 0.3383 | Yes | ||
| 6 | ARRB2 | na | 2007 | 0.564 | 0.3803 | Yes | ||
| 7 | ARRB1 | na | 2208 | 0.518 | 0.4131 | Yes | ||
| 8 | GNA14 | na | 2358 | 0.478 | 0.4453 | Yes | ||
| 9 | LYN | na | 2578 | 0.436 | 0.4700 | Yes | ||
| 10 | PLD2 | na | 2882 | 0.379 | 0.4852 | Yes | ||
| 11 | PLCB2 | na | 2928 | 0.372 | 0.5143 | Yes | ||
| 12 | DOCK2 | na | 3134 | 0.338 | 0.5315 | Yes | ||
| 13 | PRKCA | na | 3293 | 0.318 | 0.5496 | Yes | ||
| 14 | PIK3CG | na | 3383 | 0.305 | 0.5705 | Yes | ||
| 15 | RAB5A | na | 3687 | 0.273 | 0.5767 | Yes | ||
| 16 | VASP | na | 4306 | 0.216 | 0.5603 | No | ||
| 17 | PDPK1 | na | 6743 | 0.079 | 0.4303 | No | ||
| 18 | PPP2CA | na | 6915 | 0.071 | 0.4267 | No | ||
| 19 | GNAI2 | na | 6978 | 0.069 | 0.4291 | No | ||
| 20 | GNB1 | na | 7404 | 0.052 | 0.4097 | No | ||
| 21 | PPP2R1A | na | 7825 | 0.036 | 0.3892 | No | ||
| 22 | RAB7A | na | 8179 | 0.023 | 0.3713 | No | ||
| 23 | RAC2 | na | 9690 | -0.036 | 0.2895 | No | ||
| 24 | RAB11A | na | 10482 | -0.066 | 0.2508 | No | ||
| 25 | CXCR2 | na | 11680 | -0.119 | 0.1936 | No | ||
| 26 | CBL | na | 11935 | -0.130 | 0.1904 | No | ||
| 27 | AKT1 | na | 11942 | -0.131 | 0.2012 | No | ||
| 28 | GNA15 | na | 12813 | -0.178 | 0.1674 | No | ||
| 29 | PLCB3 | na | 13929 | -0.256 | 0.1266 | No | ||
| 30 | DNM1 | na | 15565 | -0.470 | 0.0747 | No | ||
| 31 | PRKCB | na | 16214 | -0.624 | 0.0913 | No |