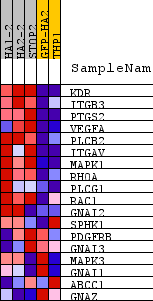
Profile of the Running ES Score & Positions of GeneSet Members on the Rank Ordered List
| Dataset | normalized_counts_per_kilobase_for_GSEA_2.class_2.cls #AHRR-overexpressed_versus_Control |
| Phenotype | class_2.cls#AHRR-overexpressed_versus_Control |
| Upregulated in class | AHRR-overexpressed |
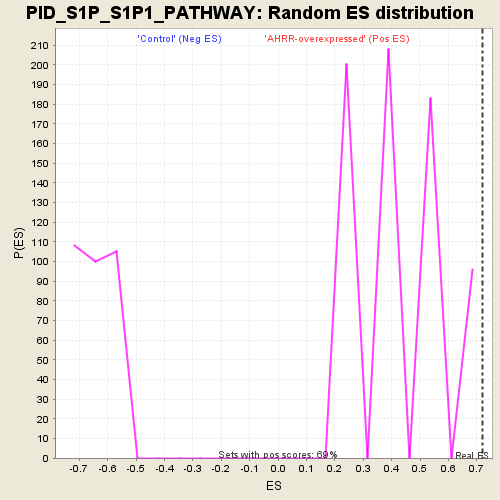
| GeneSet | PID_S1P_S1P1_PATHWAY |
| Enrichment Score (ES) | 0.7205556 |
| Normalized Enrichment Score (NES) | 1.625234 |
| Nominal p-value | 0.0 |
| FDR q-value | 0.18817732 |
| FWER p-Value | 0.491 |
| PROBE | DESCRIPTION (from dataset) | GENE SYMBOL | GENE_TITLE | RANK IN GENE LIST | RANK METRIC SCORE | RUNNING ES | CORE ENRICHMENT | |
|---|---|---|---|---|---|---|---|---|
| 1 | KDR | na | 163 | 2.661 | 0.2608 | Yes | ||
| 2 | ITGB3 | na | 273 | 2.109 | 0.4687 | Yes | ||
| 3 | PTGS2 | na | 277 | 2.088 | 0.6804 | Yes | ||
| 4 | VEGFA | na | 1182 | 0.896 | 0.7206 | Yes | ||
| 5 | PLCB2 | na | 2928 | 0.372 | 0.6604 | No | ||
| 6 | ITGAV | na | 3144 | 0.337 | 0.6824 | No | ||
| 7 | MAPK1 | na | 4266 | 0.219 | 0.6418 | No | ||
| 8 | RHOA | na | 5237 | 0.152 | 0.6028 | No | ||
| 9 | PLCG1 | na | 5287 | 0.149 | 0.6152 | No | ||
| 10 | RAC1 | na | 5908 | 0.117 | 0.5923 | No | ||
| 11 | GNAI2 | na | 6978 | 0.069 | 0.5393 | No | ||
| 12 | SPHK1 | na | 8462 | 0.011 | 0.4573 | No | ||
| 13 | PDGFRB | na | 8981 | -0.008 | 0.4291 | No | ||
| 14 | GNAI3 | na | 9467 | -0.027 | 0.4047 | No | ||
| 15 | MAPK3 | na | 9820 | -0.041 | 0.3890 | No | ||
| 16 | GNAI1 | na | 10585 | -0.071 | 0.3533 | No | ||
| 17 | ABCC1 | na | 11653 | -0.117 | 0.3053 | No | ||
| 18 | GNAZ | na | 15230 | -0.412 | 0.1465 | No |