Profile of the Running ES Score & Positions of GeneSet Members on the Rank Ordered List
| Dataset | normalized_counts_per_kilobase_for_GSEA_2.class_2.cls #AHRR-overexpressed_versus_Control |
| Phenotype | class_2.cls#AHRR-overexpressed_versus_Control |
| Upregulated in class | Control |
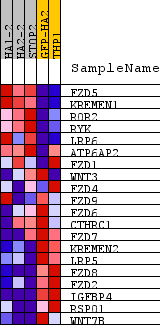
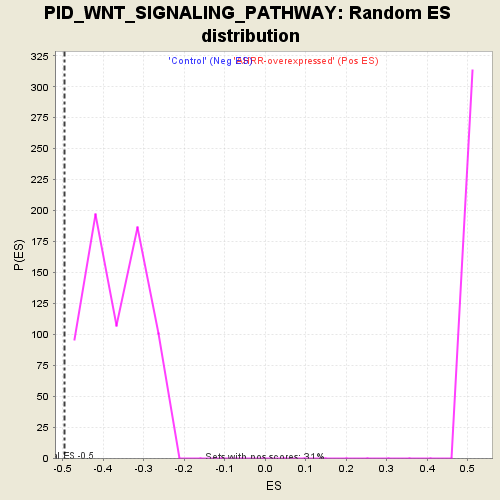
| GeneSet | PID_WNT_SIGNALING_PATHWAY |
| Enrichment Score (ES) | -0.495143 |
| Normalized Enrichment Score (NES) | -1.355386 |
| Nominal p-value | 0.0 |
| FDR q-value | 1.0 |
| FWER p-Value | 1.0 |
| PROBE | DESCRIPTION (from dataset) | GENE SYMBOL | GENE_TITLE | RANK IN GENE LIST | RANK METRIC SCORE | RUNNING ES | CORE ENRICHMENT | |
|---|---|---|---|---|---|---|---|---|
| 1 | FZD5 | na | 1093 | 0.949 | 0.0224 | No | ||
| 2 | KREMEN1 | na | 1458 | 0.760 | 0.0689 | No | ||
| 3 | ROR2 | na | 1554 | 0.715 | 0.1266 | No | ||
| 4 | RYK | na | 3003 | 0.360 | 0.0771 | No | ||
| 5 | LRP6 | na | 3080 | 0.347 | 0.1034 | No | ||
| 6 | ATP6AP2 | na | 4034 | 0.239 | 0.0710 | No | ||
| 7 | FZD1 | na | 8310 | 0.018 | -0.1673 | No | ||
| 8 | WNT3 | na | 10043 | -0.050 | -0.2601 | No | ||
| 9 | FZD4 | na | 10131 | -0.053 | -0.2603 | No | ||
| 10 | FZD9 | na | 10437 | -0.065 | -0.2717 | No | ||
| 11 | FZD6 | na | 11710 | -0.120 | -0.3325 | No | ||
| 12 | CTHRC1 | na | 14610 | -0.328 | -0.4662 | Yes | ||
| 13 | FZD7 | na | 14718 | -0.342 | -0.4421 | Yes | ||
| 14 | KREMEN2 | na | 14995 | -0.377 | -0.4243 | Yes | ||
| 15 | LRP5 | na | 15478 | -0.455 | -0.4113 | Yes | ||
| 16 | FZD8 | na | 15695 | -0.497 | -0.3796 | Yes | ||
| 17 | FZD2 | na | 16311 | -0.655 | -0.3563 | Yes | ||
| 18 | IGFBP4 | na | 17371 | -1.332 | -0.2983 | Yes | ||
| 19 | RSPO1 | na | 17462 | -1.449 | -0.1756 | Yes | ||
| 20 | WNT7B | na | 17705 | -2.232 | 0.0076 | Yes |