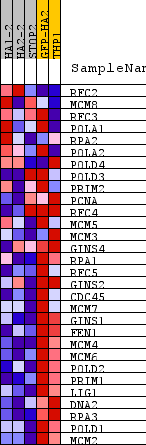
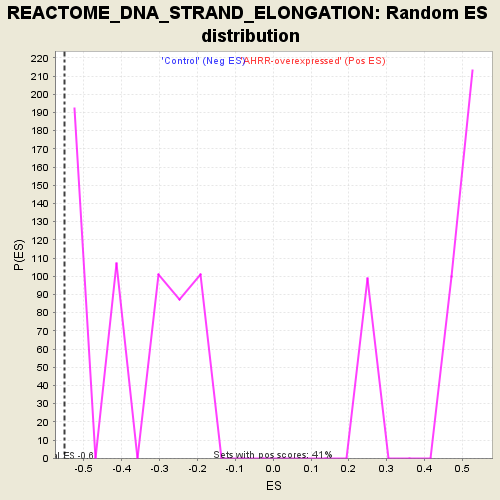
Profile of the Running ES Score & Positions of GeneSet Members on the Rank Ordered List
| Dataset | normalized_counts_per_kilobase_for_GSEA_2.class_2.cls #AHRR-overexpressed_versus_Control |
| Phenotype | class_2.cls#AHRR-overexpressed_versus_Control |
| Upregulated in class | Control |
| GeneSet | REACTOME_DNA_STRAND_ELONGATION |
| Enrichment Score (ES) | -0.55131507 |
| Normalized Enrichment Score (NES) | -1.5138538 |
| Nominal p-value | 0.0 |
| FDR q-value | 1.0 |
| FWER p-Value | 0.9 |
| PROBE | DESCRIPTION (from dataset) | GENE SYMBOL | GENE_TITLE | RANK IN GENE LIST | RANK METRIC SCORE | RUNNING ES | CORE ENRICHMENT | |
|---|---|---|---|---|---|---|---|---|
| 1 | RFC2 | na | 6913 | 0.071 | -0.3737 | No | ||
| 2 | MCM8 | na | 7144 | 0.062 | -0.3740 | No | ||
| 3 | RFC3 | na | 7865 | 0.034 | -0.4076 | No | ||
| 4 | POLA1 | na | 8394 | 0.014 | -0.4343 | No | ||
| 5 | RPA2 | na | 8398 | 0.014 | -0.4317 | No | ||
| 6 | POLA2 | na | 8491 | 0.011 | -0.4347 | No | ||
| 7 | POLD4 | na | 9774 | -0.039 | -0.4988 | No | ||
| 8 | POLD3 | na | 9942 | -0.046 | -0.4990 | No | ||
| 9 | PRIM2 | na | 10559 | -0.070 | -0.5195 | No | ||
| 10 | PCNA | na | 11127 | -0.093 | -0.5325 | Yes | ||
| 11 | RFC4 | na | 11359 | -0.104 | -0.5245 | Yes | ||
| 12 | MCM5 | na | 11718 | -0.120 | -0.5203 | Yes | ||
| 13 | MCM3 | na | 11801 | -0.124 | -0.4998 | Yes | ||
| 14 | GINS4 | na | 12010 | -0.134 | -0.4845 | Yes | ||
| 15 | RPA1 | na | 12156 | -0.142 | -0.4640 | Yes | ||
| 16 | RFC5 | na | 12490 | -0.160 | -0.4503 | Yes | ||
| 17 | GINS2 | na | 12855 | -0.180 | -0.4343 | Yes | ||
| 18 | CDC45 | na | 12880 | -0.182 | -0.3989 | Yes | ||
| 19 | MCM7 | na | 13111 | -0.197 | -0.3721 | Yes | ||
| 20 | GINS1 | na | 13321 | -0.211 | -0.3412 | Yes | ||
| 21 | FEN1 | na | 13484 | -0.222 | -0.3055 | Yes | ||
| 22 | MCM4 | na | 13591 | -0.230 | -0.2650 | Yes | ||
| 23 | MCM6 | na | 13731 | -0.241 | -0.2241 | Yes | ||
| 24 | POLD2 | na | 14064 | -0.270 | -0.1881 | Yes | ||
| 25 | PRIM1 | na | 14247 | -0.287 | -0.1404 | Yes | ||
| 26 | LIG1 | na | 14442 | -0.308 | -0.0889 | Yes | ||
| 27 | DNA2 | na | 14447 | -0.309 | -0.0267 | Yes | ||
| 28 | RPA3 | na | 14591 | -0.326 | 0.0311 | Yes | ||
| 29 | POLD1 | na | 14892 | -0.363 | 0.0876 | Yes | ||
| 30 | MCM2 | na | 15059 | -0.385 | 0.1562 | Yes |