Profile of the Running ES Score & Positions of GeneSet Members on the Rank Ordered List
| Dataset | normalized_counts_per_kilobase_for_GSEA_2.class_2.cls #AHRR-overexpressed_versus_Control |
| Phenotype | class_2.cls#AHRR-overexpressed_versus_Control |
| Upregulated in class | Control |
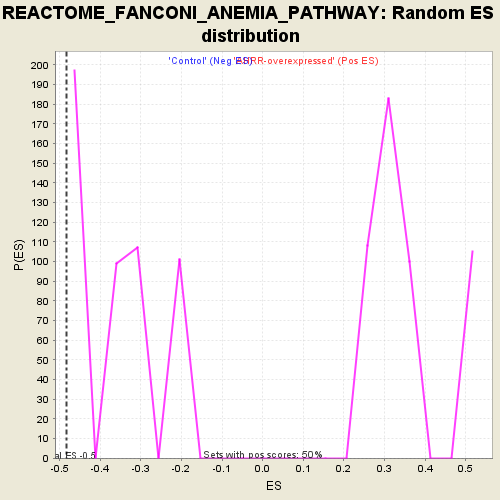
| GeneSet | REACTOME_FANCONI_ANEMIA_PATHWAY |
| Enrichment Score (ES) | -0.48288122 |
| Normalized Enrichment Score (NES) | -1.2862322 |
| Nominal p-value | 0.20039682 |
| FDR q-value | 1.0 |
| FWER p-Value | 1.0 |
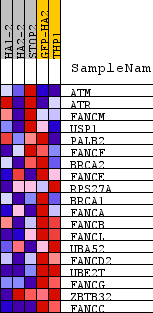
| PROBE | DESCRIPTION (from dataset) | GENE SYMBOL | GENE_TITLE | RANK IN GENE LIST | RANK METRIC SCORE | RUNNING ES | CORE ENRICHMENT | |
|---|---|---|---|---|---|---|---|---|
| 1 | ATM | na | 6065 | 0.109 | -0.2955 | No | ||
| 2 | ATR | na | 7102 | 0.064 | -0.3275 | No | ||
| 3 | FANCM | na | 8057 | 0.027 | -0.3698 | No | ||
| 4 | USP1 | na | 8099 | 0.026 | -0.3617 | No | ||
| 5 | PALB2 | na | 8303 | 0.018 | -0.3657 | No | ||
| 6 | FANCF | na | 8839 | -0.003 | -0.3944 | No | ||
| 7 | BRCA2 | na | 10139 | -0.054 | -0.4453 | No | ||
| 8 | FANCE | na | 10809 | -0.080 | -0.4501 | Yes | ||
| 9 | RPS27A | na | 10937 | -0.086 | -0.4222 | Yes | ||
| 10 | BRCA1 | na | 11195 | -0.096 | -0.3972 | Yes | ||
| 11 | FANCA | na | 11436 | -0.107 | -0.3667 | Yes | ||
| 12 | FANCB | na | 11477 | -0.109 | -0.3243 | Yes | ||
| 13 | FANCL | na | 12306 | -0.149 | -0.3097 | Yes | ||
| 14 | UBA52 | na | 13082 | -0.195 | -0.2732 | Yes | ||
| 15 | FANCD2 | na | 13141 | -0.199 | -0.1951 | Yes | ||
| 16 | UBE2T | na | 13660 | -0.236 | -0.1275 | Yes | ||
| 17 | FANCG | na | 14077 | -0.271 | -0.0398 | Yes | ||
| 18 | ZBTB32 | na | 14362 | -0.300 | 0.0670 | Yes | ||
| 19 | FANCC | na | 14491 | -0.313 | 0.1880 | Yes |